Crypto Market Commentary
15 October 2019

Doc's Daily Commentary
The 10/9 ReadySetLive Update with Doc & Mav is listed below.

Mind Of Mav
Is Bitcoin A Prime “Buy” Right Now?
Review
After an impressive rally in the first half of 2019 Bitcoin reached a high point on June 26th, 2019 at US$13,887. Since then, there has been a correction of several months now, which has resulted in the long-awaited pullback down to below US$8,000. Despite three small dips, Bitcoin had managed to hold above US$9,450 during summer. However, since early September, market participants became increasingly aware of the emerging descending triangle. Finally, on September 24, Bitcoin prices not only dropped below the lines of support but slid to almost US$7,700 without much opposition. Only at this lower level, a stabilization can be observed since two weeks, but so far, this base has not been able to initiate a little bounce at least.
Technical Analysis For Bitcoin
For investors and swing traders, whose time horizons should be at least a few weeks but ideally several months or years, the US$6,200 to US$8,200 zone is now an admittedly broad but meaningful buying zone. The remaining downside risk seems manageable. Only if Bitcoin falls below US$5,800 again, we must expect the continuation of the crypto winter.
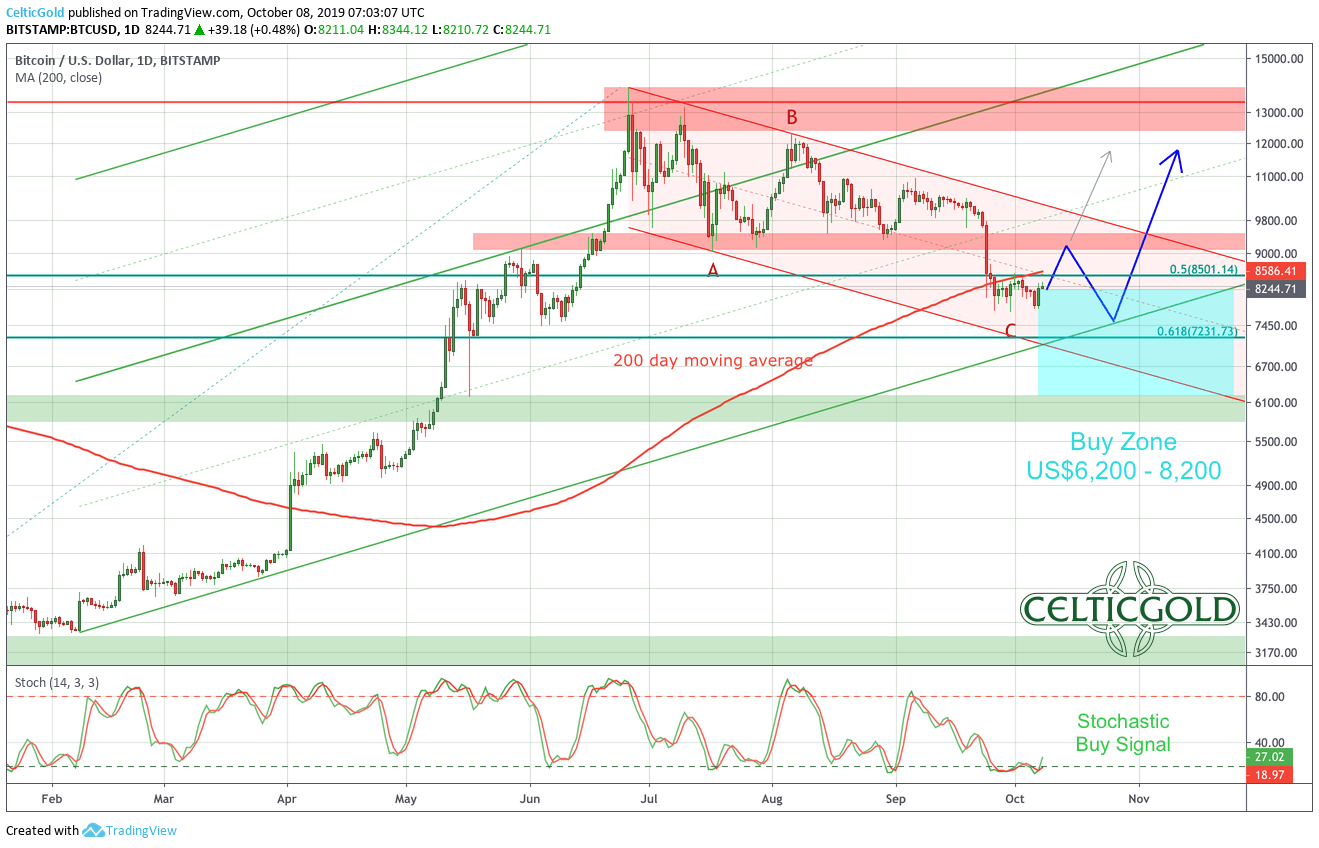 Source: Tradingview
Overall, a recovery to US$9,100 is likely to be more or less imminent. However, if bulls fail here, Bitcoin will sell off again and might very likely fall even below US$7,700 to test the uptrend-line (currently around US$7,050). Just like on the weekly chart, incremental purchases between US$6,200 and US$8,200 make sense.
Commitments of Traders Report For Bitcoin
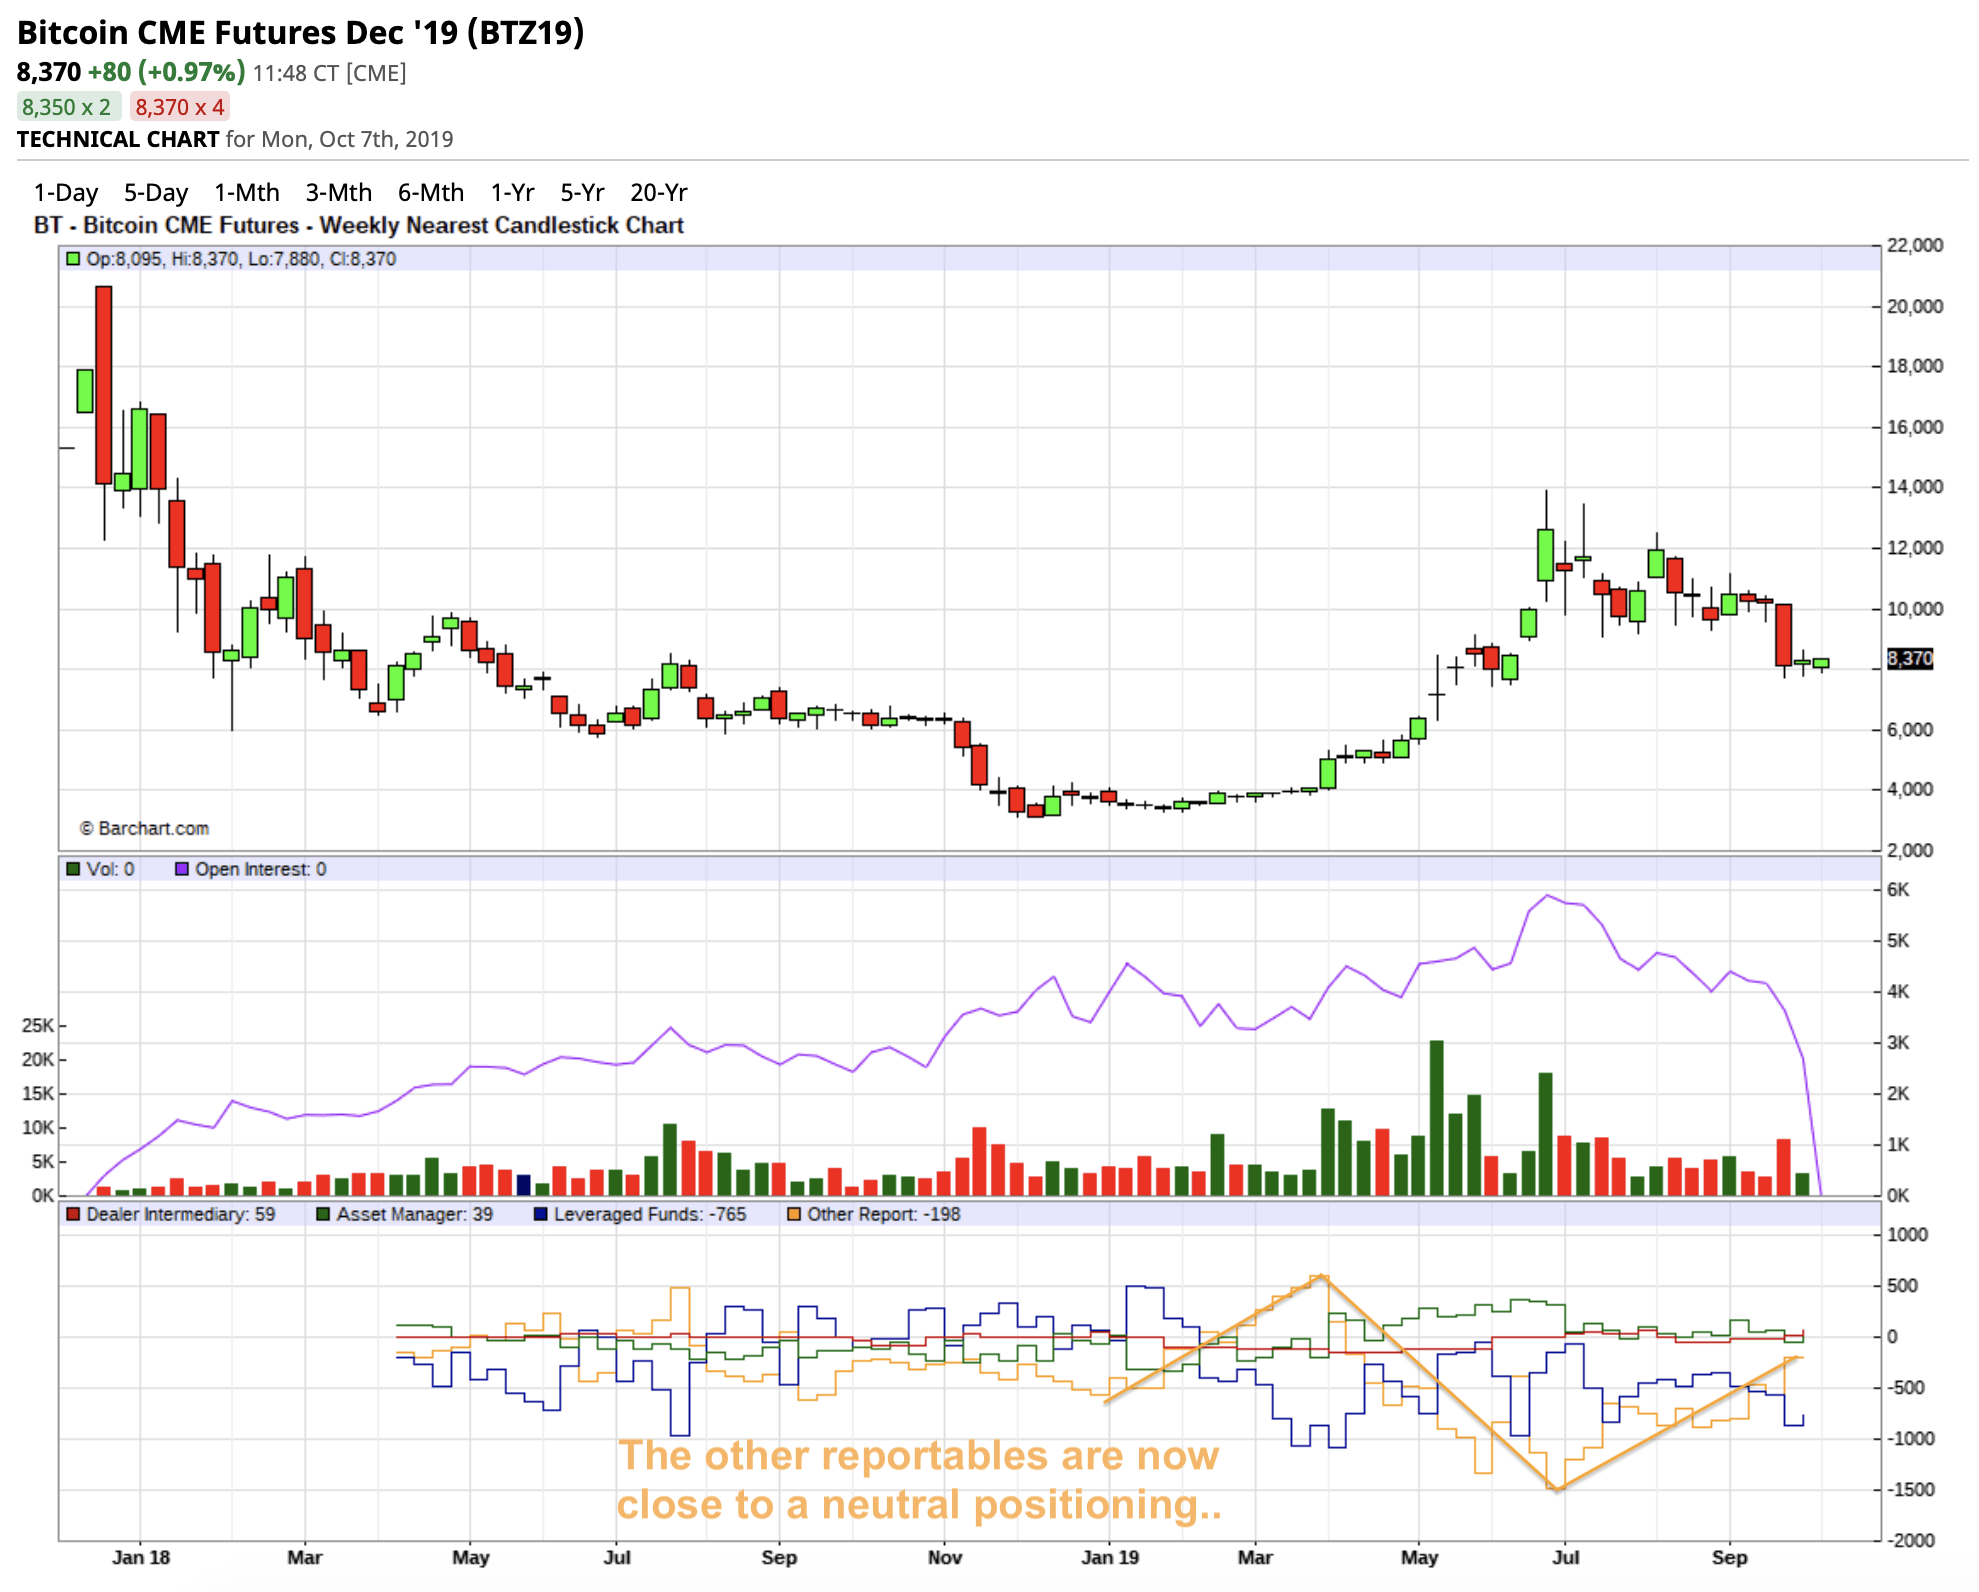 Source: Barchart
The decline in price has further improved the CoT report for the Bitcoin Futures. Although there is not yet a real contrarian bottleneck, the “Other Reportables” group has almost completely covered their short positions. Among the “Other Reportables”, the U.S. Commodity Futures Trading Commission (CFTC) puts together all reportable traders who cannot be attributed to any of the three groups of producers, swap dealers or money managers together. From a contrarian point of view and in retrospect, this group has played the bitcoin rally almost perfectly this year, because at the start of the rally, in April, they were heavily positioned on the long side. Until mid-June, the “Other Reportables” then moved further and further to the short side. In the last three months, they have gradually covered their shorts into falling prices again. As soon as this group starts building up long positions again, we should do the same way.
If one follows the group of the “Other Reportables”, the remaining risk on the downside is very is now rather small. However, this group is not yet positioned for a new upturn in Bitcoin. So, the CoT report is still suggesting more patience.
Sentiment Bitcoin
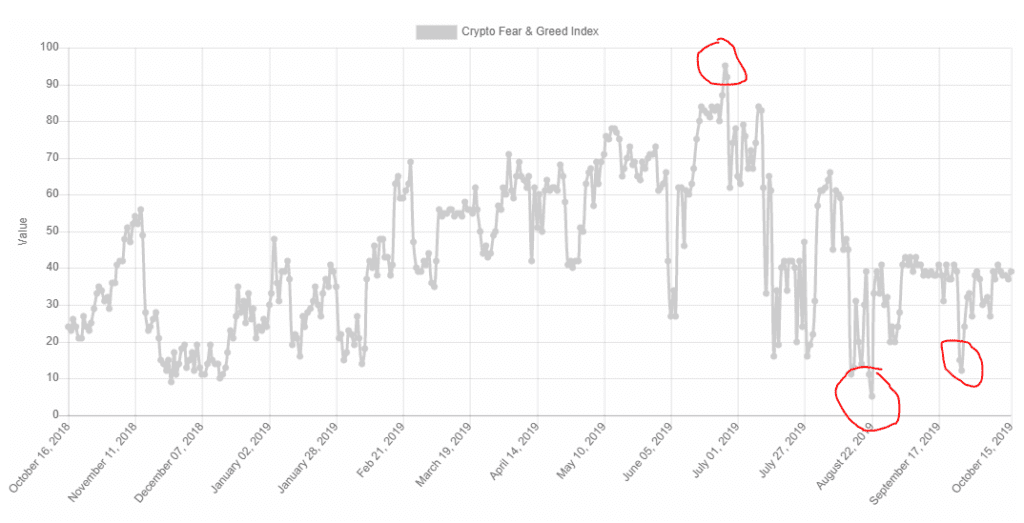
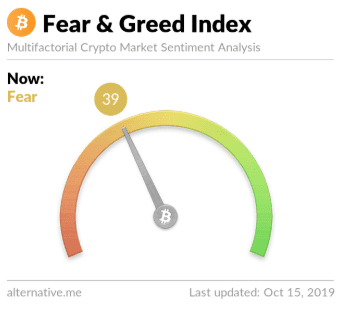
Source: Crypto Fear & Greed Index
The little crash below US$9,000 three weeks ago created a highly pessimistic sentiment. “Sentimentrader” as well as the “Fear & Greed Index” clearly show that there is too much fear among market participants. Therefore, sentiment analysis provides a buy signal.
Seasonality Bitcoin

Source: Seasonax
Based on the evaluation of the first 10 years of its existence, Bitcoin has developed a fairly clear seasonal pattern. Currently, we would be at the beginning of a solid upward movement, which is statistically typical for the 4th quarter of the Bitcoin. In summary, seasonality provides a buy signal too. Any further setback could be the starting point for a rally over the next two to three months.
The average price gain achieved between October 11 and January 05 amounted to 78.83 percent. Due to compounding effects this is equivalent to an extremely large annualized gain of 1,080.82 percent.
Bitcoin Rallied in 7 out of 9 Cases
What happened in individual years? The following barchart shows the return generated by Bitcoin between October 11 and January 05 in every year since 2010. Blue bars show years in which positive returns were achieved, red bars show the years that generated negative returns.
Bitcoin, return in percent between October 11 and January 05 in individual years since 2010

The Precise Annual Seasonal Pattern of Bitcoin
Let us take a close look at the seasonal pattern of Bitcoin.
The chart below shows the typical price pattern of Bitcoin in the course of a calendar year. The horizontal axis denotes the time of the year, the vertical axis the level of the seasonal index.
Bitcoin, seasonal pattern calculated over 9 years

A seasonal rally begins on October 11.
As the chart shows, there is typically an autumn rally in Bitcoin, similar to the one in the stock market. It begins on October 11 and ends on January 05 of the next year.
Bitcoin against Gold
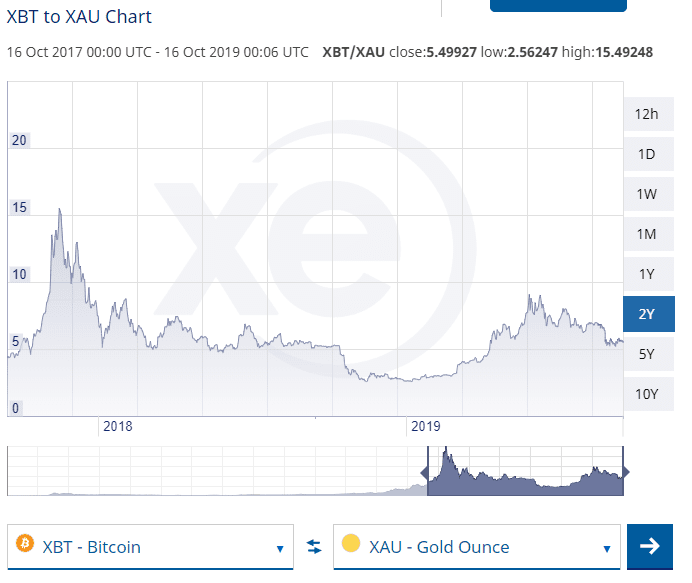
Source: XE
Currently, a bitcoin “only” costs 5.49 ounces of gold (GLD). In other words, one ounce of gold currently costs 0.18 Bitcoin! Thus, gold has appreciated by more than 33% against Bitcoin in the last three months. Due to the current opportunity in Bitcoin determined in this analysis, as well as the undeniable probability of a gold price correction, the focus or the overweighting towards Bitcoin gradually makes sense again.
Conclusion and recommendation
As expected, Bitcoin prices have corrected strongly in the last three and a half months and have now closed the open gap on the Bitcoin future around US$8,500. Basically, whenever a market rises sharply, it will and must then also correct strongly. That’s exactly what happened to Bitcoin again. Basically, a normal and healthy process. Contrarian and patient investors are now finding a sold-out market that once again offers wonderful opportunities on the upside. Although the bottom may not yet be found, the downside risk is very comprehensive. The worst case scenario is a final selloff towards US$6,200. However, given the typically strong 4th quarter, it does not necessarily have to be such a low price anymore.
In any case, we are now in the accumulation phase. Multiple smaller purchases on weak days between 6,200 and 8,200 US dollars should lead to considerable profits within a few months. Maybe the currently depressed prices are the last chance to get into Bitcoin before the rally towards the all-time highs around US$20,000 starts. That alone would be more than a double from current price!
On top of that, the market capitalization and all the fundamental indicators such as the number and use of Bitcoin wallets, the size of each individual block, the number of transactions as well as the hash-rate and the value of the entire network have been continuously growing for 10 years.
Press the "Connect" Button Below to Join Our Discord Community!
Please DM us with your email address if you are a full OMNIA member and want to be given full Discord privileges.
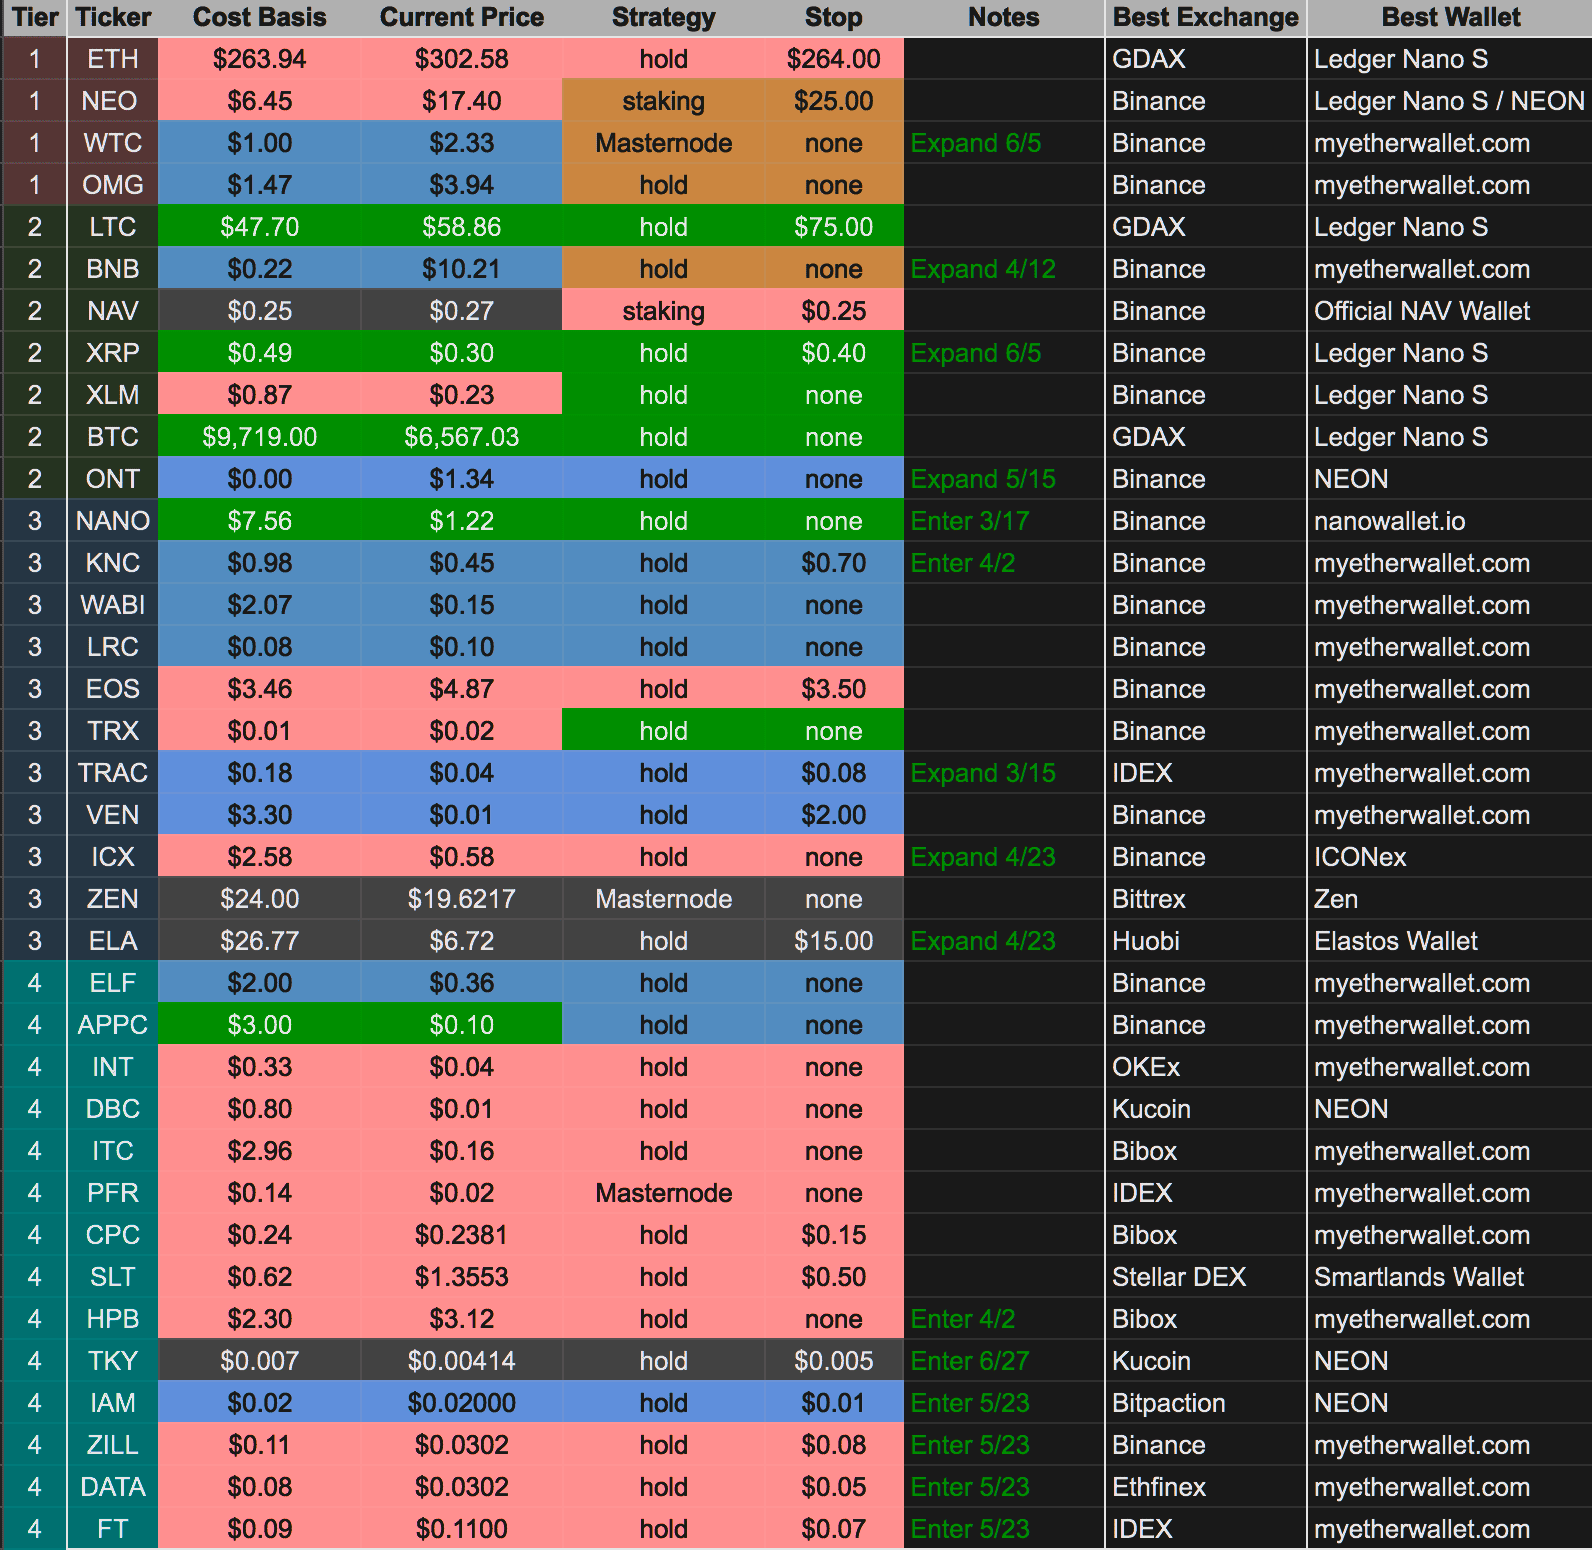
An Update Regarding Our Portfolio
RSC Subscribers,
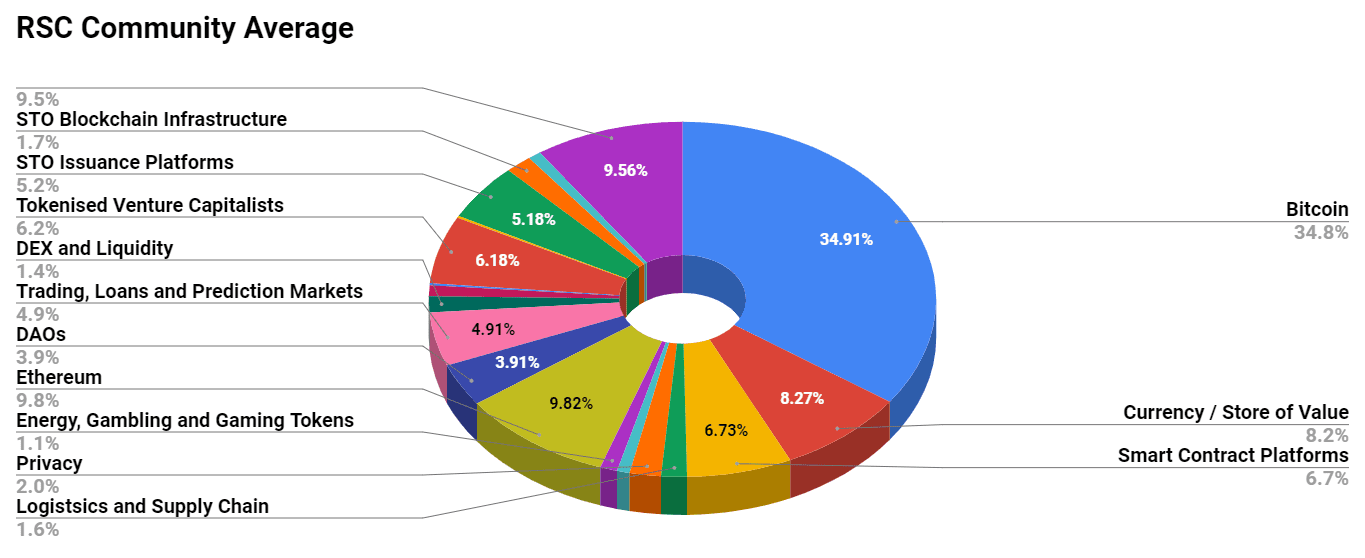
We are pleased to share with you our Community Portfolio V3!
Add your own voice to our portfolio by clicking here.
We intend on this portfolio being balanced between the Three Pillars of the Token Economy & Interchain:
Crypto, STOs, and DeFi projects
We will also make a concerted effort to draw from community involvement and make this portfolio community driven.
Here’s our past portfolios for reference:
RSC Managed Portfolio (V2)
[visualizer id=”84848″]
RSC Unmanaged Altcoin Portfolio (V2)
[visualizer id=”78512″]
RSC Managed Portfolio (V1)