

Doc's Daily Commentary

Mind Of Mav
Why Bitcoin Is Oversold (Even If It Drops Lower)
Traders and investors have been out there hunting for stock market bargains after an “everything rout”. and the same seems to be happening in crypto.
At time of writing, the world’s largest cryptocurrency has dropped 20% to hit a 2022 low of $31.2k.
Multiple on-chain signals are flashing that Bitcoin is oversold. That’s not to say it won’t fall further from here, and this is not investment advice. There is significant volatility ongoing across asset classes and markets are on edge following central bank rate hikes, decades-high inflation prints and severe liquidity concerns. But it’s worth having a look at a couple of these metrics.
The word ‘oversold’ is a trading term refers to assets that have seen large and speedy price declines without a significant upside correction.
Deploying capital when everyone else in the market is running away and screaming in despair is a favoured strategy of some long-term investors, most notably seminal value investing author Benjamin Graham and his protégé Warren Buffett. (Mr Buffett probably wouldn’t like me to invoke his name in this regard, having called Bitcoin “rat poison squared”, but if even JP Morgan CEO Jamie Dimon can change his tune, then anyone can.)
Below are the four charts I’d like to point readers towards.
Bitcoin Monthly Average RSI at two-year low
I’d like to talk about RSI first.
RSI, or Relative Strength Index, is a metric which tracks momentum in asset pricing. Bitcoin’s monthly average RSI as of 10 May 2022 was 46.66, its lowest point in two years.
In crypto markets, an RSI of 80 or above generally shows that traders have hit peak euphoria and a coin or token is ‘overbought’. An RSI of 50 or below generally shows that traders have hit peak panic and a coin or token is ‘oversold’.
In fact, there have been only five months in the past five years when monthly average RSI was lower than it is today.

All of these points came during the Crypto Winter of late 2018 to early 2019.
BTC had crashed from $6,500 to $3,500 and remained there for four months.
Indeed, BTC has been at a higher monthly RSI for 90% of the time tracked by this metric, which goes back to July 2010.
To summarise:
— High RSI shows that prices are moving positively compared to the past 12 months
— Low RSI shows that prices are moving negatively compared to the past 12 months
RSI not only measures the extent of directional price movements up or down, it also measure how quickly those movements are happening.
To quote Warren Buffett, “the market is a manic depressive”.
This speaks to Charles MacKay’s early study of large-group psychology: what he called the madness of crowds. At times, investors are overly optimistic and willing to buy assets at a high premium, while at other times they are struck with pessimism and unwilling to buy assets despite a large discount.
Bitcoin near Macro Range Low
In terms of its own macro range, Bitcoin is in a funk. $28k to $35k represents its range low going back to early 2021.
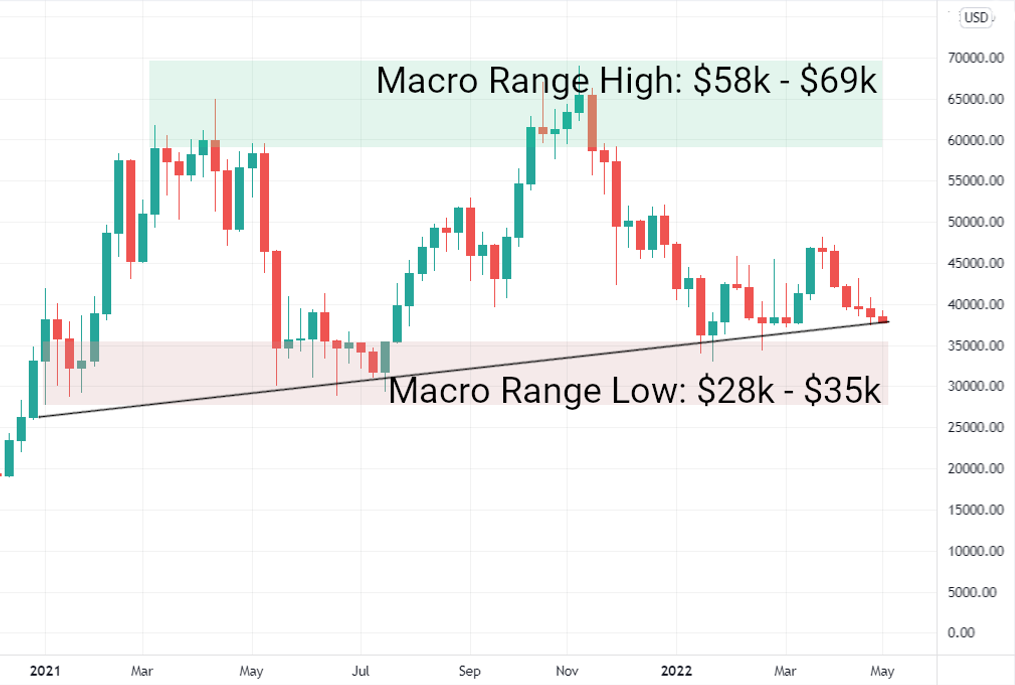
That’s absolutely not to say that Bitcoin won’t fall further from here before a rebound. No-one can tell you which way asset prices will move in the future, and anyone that claims to be able to is either a charlatan or an outright liar.
Institutional investors add $45m on BTC weakness
While we may not have hit the bottom of Bitcoin’s macro range yet — that comes at around $28k — some institutional investment has started to flow back into structured Bitcoin ETPs and ETFs which track the price of BTC and trade on fully regulated exchanges.
Institutional investors, including private banks and wealthy asset managers added $45m net inflows into BTC in the week from 1 May to 8 May 2022.
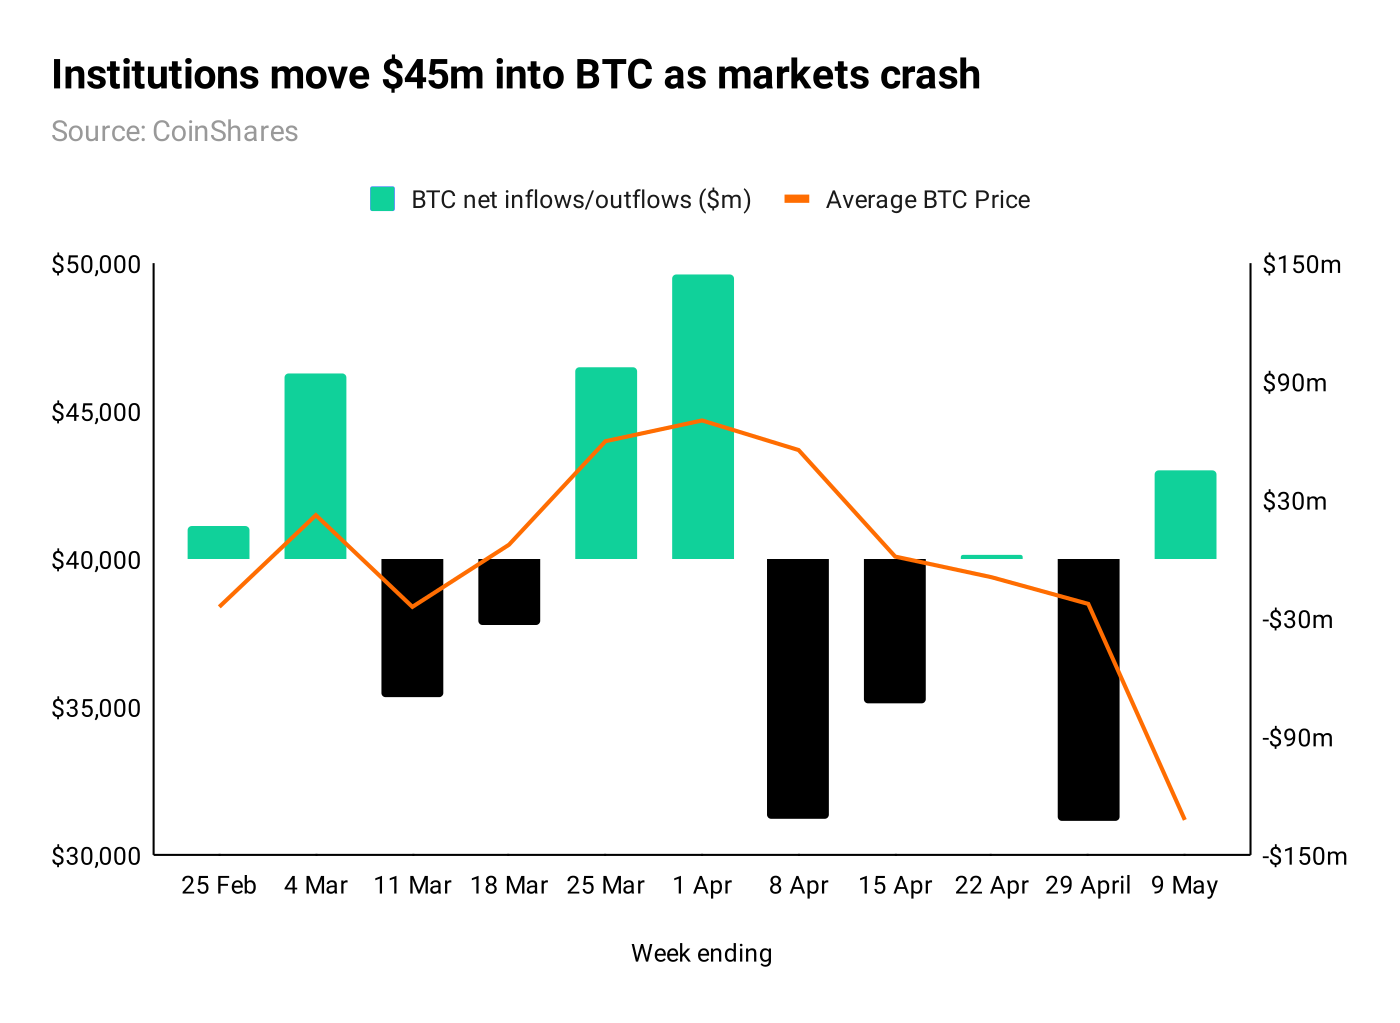
While it may be too early to tell whether this represents a bottomed-out price, that decision to pile in on weakness after four largely negative weeks is not so surprising.
Certainly not when we look at how stock markets performed in the wake of the biggest macro event to hit the world in decades. Yes, I’m talking about the C-word.
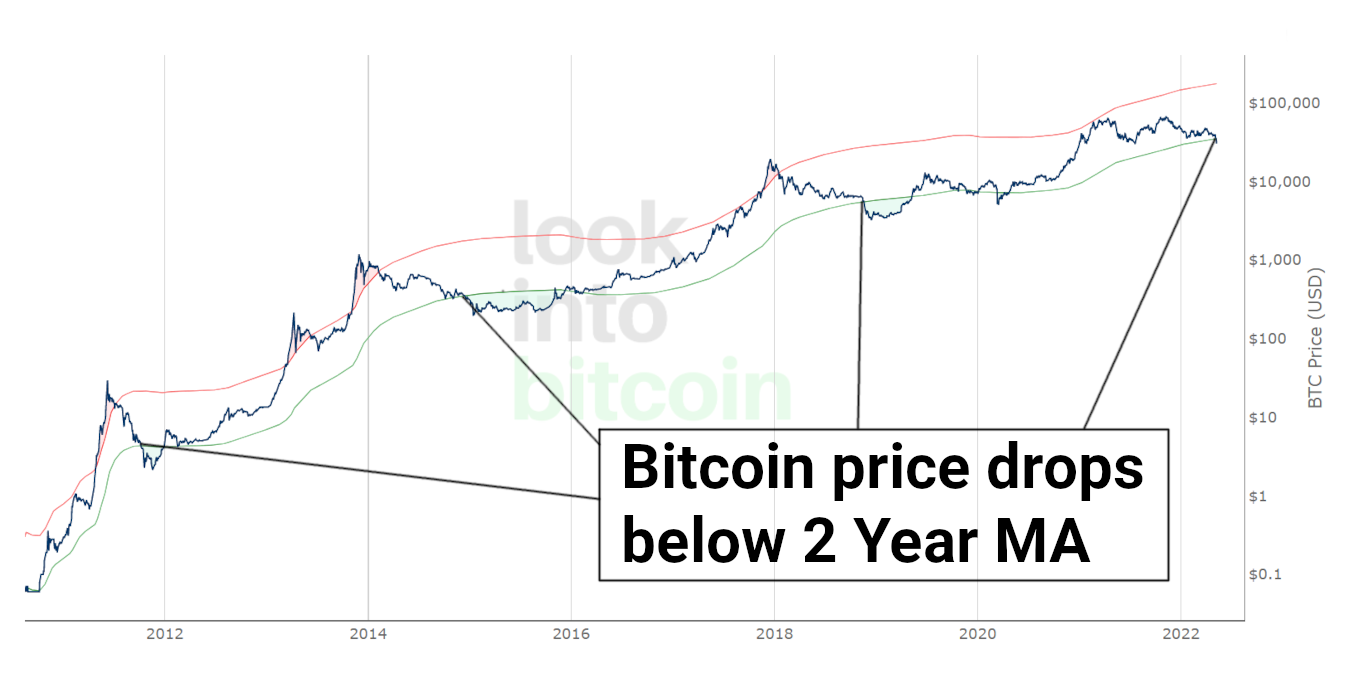
2 year MA Multiplier flashing oversold
Among all the crypto data providers (who mostly charge exorbitant sums for at-market access), there are still those who don’t hide data behind a paywall. One of those is LookintoBitcoin.com. Site founder Philip Swift, who tweets over @PhilipSwift, created the 2 year MA Multiplier. It takes the moving average (MA) price of Bitcoin over the last 24 months and compares it to a simple 5x multiplier.
Buying Bitcoin when the price drops below the green line (the two-year Moving Average) and selling when the price shifts up above the red line (the two year Moving Average x5) has historically generated outsize returns.
In the last week, the price of Bitcoin has fallen below the green line, its 2 year Moving Average, for the first time since March 2020.

The ReadySetCrypto "Three Token Pillars" Community Portfolio (V3)
Add your vote to the V3 Portfolio (Phase 3) by clicking here.
View V3 Portfolio (Phase 2) by clicking here.
View V3 Portfolio (Phase 1) by clicking here.
Read the V3 Portfolio guide by clicking here.
What is the goal of this portfolio?
The “Three Token Pillars” portfolio is democratically proportioned between the Three Pillars of the Token Economy & Interchain:
CryptoCurreny – Security Tokens (STO) – Decentralized Finance (DeFi)
With this portfolio, we will identify and take advantage of the opportunities within the Three
Pillars of ReadySetCrypto. We aim to Capitalise on the collective knowledge and experience of the RSC
community & build model portfolios containing the premier companies and projects
in the industry and manage risk allocation suitable for as many people as
possible.
The Second Phase of the RSC Community Portfolio V3 was to give us a general idea of the weightings people desire in each of the three pillars and also member’s risk tolerance. The Third Phase of the RSC Community Portfolio V3 has us closing in on a finalized portfolio allocation before we consolidated onto the highest quality projects.
Our Current Allocation As Of Phase Three:

Move Your Mouse Over Charts Below For More Information

The ReadySetCrypto "Top Ten Crypto" Community Portfolio (V4)
Add your vote to the V4 Portfolio by clicking here.
Read about building Crypto Portfolio Diversity by clicking here.
What is the goal of this portfolio?
Current Top 10 Rankings:

Move Your Mouse Over Charts Below For More Information

Our Discord
Join Our Crypto Trader & Investor Chatrooms by clicking here!
Please DM us with your email address if you are a full OMNIA member and want to be given full Discord privileges.