Doc's Daily Commentary

Mind Of Mav

The World Is Running Out Of Ethereum


The available ETH in the market is drying up and becoming less liquid. Here’s what it means for future price.

 
This is the most potent combination in markets.
 
 
I liken it to a freight train.
 
 
At first its engine grunts until the creakiness gives way to a low pitched roll. Bystanders aren’t paying attention and the passengers barely even notice. The event unfolds without flashiness.
 
 
It is just a slow roll generating momentum so vague it goes almost unnoticed.
 
 
Once the train leaves the platform bystanders express subtle amazement with a raised brow in response to the 14,000 ton machine’s cadenced movement. The momentum builds… And already nothing can stop such a force.
 
 
Then as it builds speed the train exhibits a controlled velocity with destructive capacities demanding you watch as it barrels down the tracks. You don’t get in its way. Nor expect it to stop soon. And the passengers enjoying the trip boarded well before the train’s momentum reached such impressive heights.
 
 
This is the bullish momentum I see when I look at a chart of Ethereum priced in bitcoin (ETH/BTC). The price is building slowly with only a few taking note.
 
 
And even for those noticing, I don’t believe most appreciate the magnitude of what’s about to unfold.
 
 
The explosive mix of dropping ETH supply in the face of rising demand will spur the biggest mania of this bitcoin halving cycle. And it’s getting ready to unfold in a couple months.
 
 
Let me show you…
 
 
The amount of Ethereum on exchanges are dropping fast. This is similar to what we saw unfold in 2017.
From March 2017 to shortly after the market’s top in January 2018, exchanges saw 9.75 million less Ethereum in their reserves. This came out to be 44% less.


Fast forward to this bull cycle, and exchanges are witnessing 6.5 million less ETH than what was there about nine months prior. This comes out to be about 25% less in reserves.


What’s interesting in the current chart is the breakaway speed at which ETH is leaving exchanges.

 
In the chart below I highlight the drop in reserves in 2017 which led to ETH’s prior ATH (vertical blue line). It’s the breakaway speed at which ETH is leaving – shown in a green box.


We’re experiencing a similar momentum now. The only difference is the percent of ETH which ultimately left exchanges was 39% before hitting the prior ATH. This cycle, if repeated, would give us a lot more room and time before we hit a similar figure.
 
 
What makes this a bit more interesting is in understanding where a lot of the ETH not on exchanges are now sitting… That’s because unlike last time around, a significant percentage of ETH are less liquid or literally illiquid.
Here’s a breakdown:
 
 
10.7 million ETH are locked up in DeFi.


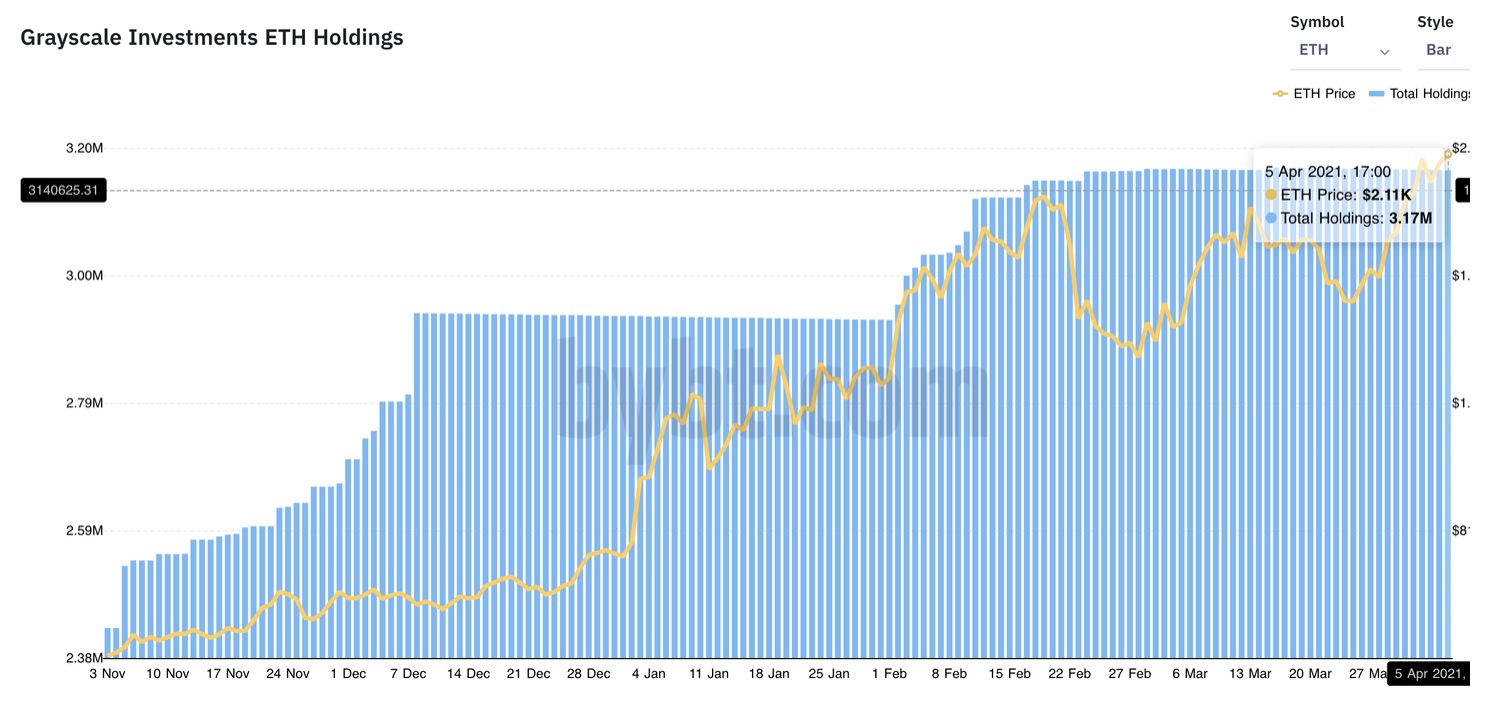
3.17 million ETH are locked up in Grayscale’s Ethereum Trust (ETHE).


3.7 million ETH are staked on Ethereum 2.0’s Beacon Chain.


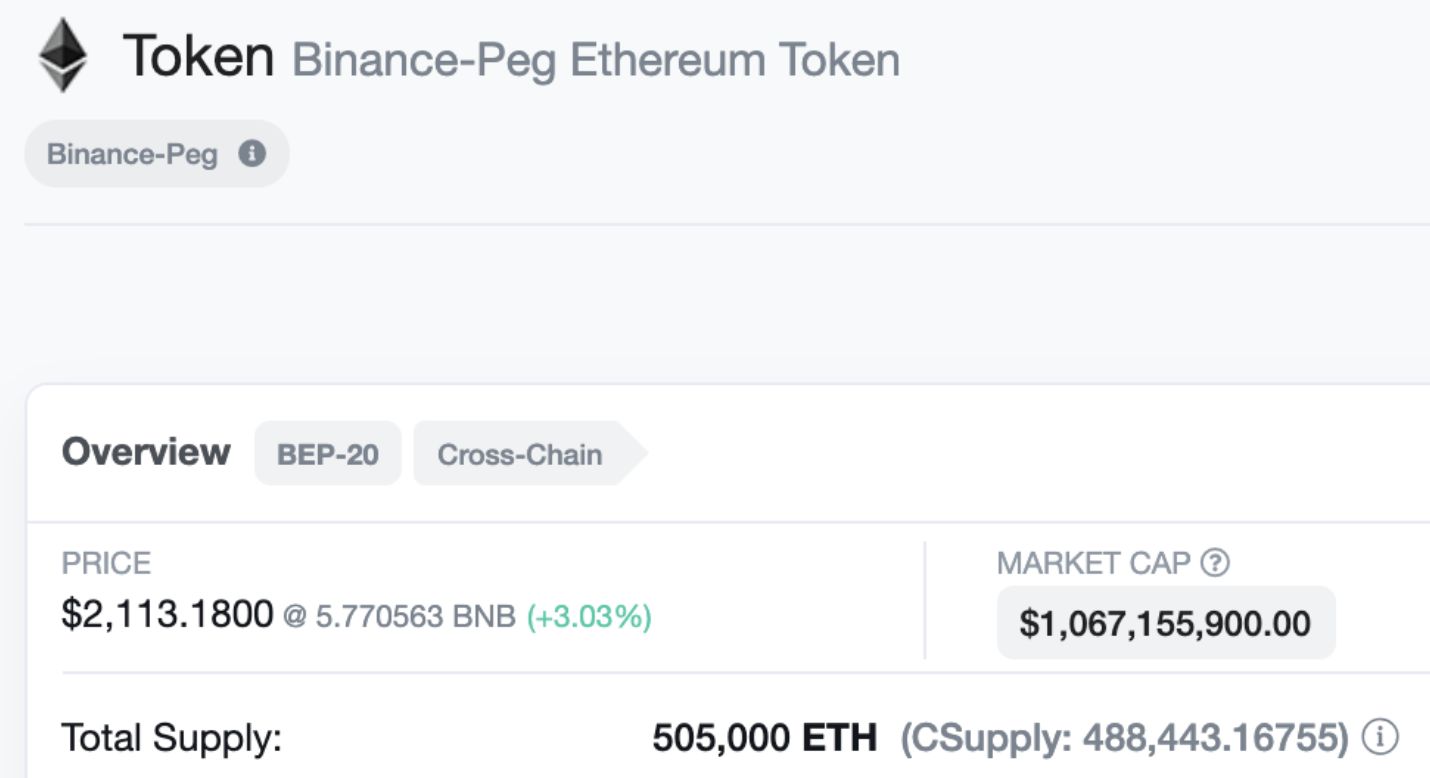
0.5 million ETH are sitting over as a BEP-20 token on Binance Chain.


That comes out to be just a bit more than 18 million ETH less liquid or virtually illiquid.

When it comes to the first part of our freight train, the reduction of supply is what goes unnoticed. It’s happening slowly and its effect on the market is not flashy.

 
The demand is what creates the explosive moves. And based upon what we’ve seen last few weeks, demand is not only here, but preparing to ramp up.
 
 
This is thanks to growing institutional demand due to the unethical management of the dollar, Grayscale Effect, and crypto slowly getting used as an everyday solution as opposed to just a speculative market (ie – Mark Cuban’s recent statements).
 
What this means is ETH’s price is gearing up for a historic run: It’s the Livermore Accumulation Cylinder chart.
 
 
The pattern is a very bullish formation that takes place before an asset turns parabolic. It’s most often seen during a cyclical bull run, which is what we are currently in.
 
What’s interesting is we are already witnessing momentum building near the “7”.


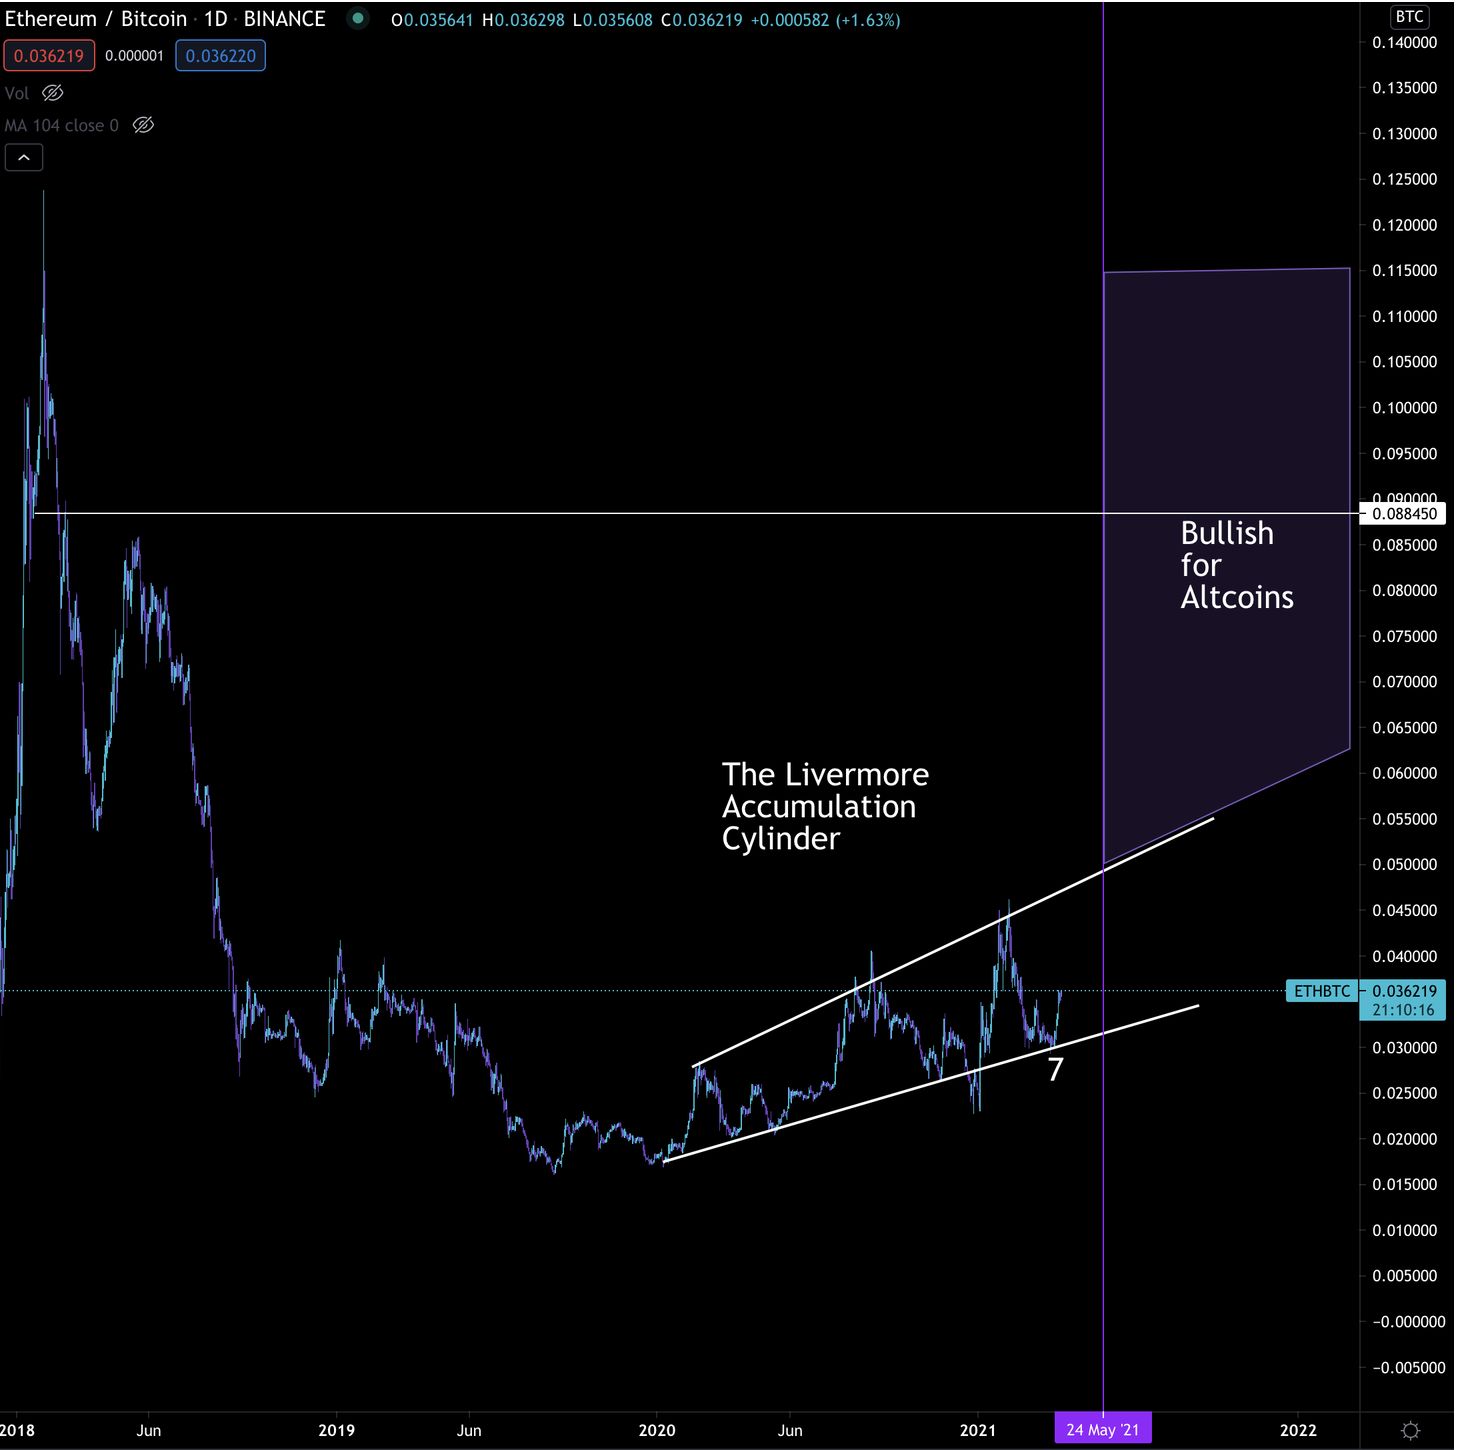
When price breaks this cylinder, it’ll create breakaway speed. Price targets can get pretty wild if one decides to take the time to do it.

 
That white horizontal line is a likely first target for this formation. That’s 0.08845 per bitcoin. If bitcoin is $120,000 when this target is met, that’s $10,614 per ETH.
 
 
If you think that’s wild, wait until you see what that type of price action does to altcoins further out on the risk curve.
 
 
It’ll be the first REAL “altseason” in three and a half years.
 
 
Punch your ticket now before Ethereum’s liquidity crisis leaves you behind.
 

The ReadySetCrypto "Three Token Pillars" Community Portfolio (V3)


Add your vote to the V3 Portfolio (Phase 3) by clicking here.

View V3 Portfolio (Phase 2) by clicking here.

View V3 Portfolio (Phase 1) by clicking here.

Read the V3 Portfolio guide by clicking here.

What is the goal of this portfolio?

The “Three Token Pillars” portfolio is democratically proportioned between the Three Pillars of the Token Economy & Interchain:

CryptoCurreny – Security Tokens (STO) – Decentralized Finance (DeFi)

With this portfolio, we will identify and take advantage of the opportunities within the Three
Pillars of ReadySetCrypto. We aim to Capitalise on the collective knowledge and experience of the RSC
community & build model portfolios containing the premier companies and projects
in the industry and manage risk allocation suitable for as many people as
possible.

The Second Phase of the RSC Community Portfolio V3 was to give us a general idea of the weightings people desire in each of the three pillars and also member’s risk tolerance. The Third Phase of the RSC Community Portfolio V3 has us closing in on a finalized portfolio allocation before we consolidated onto the highest quality projects.

Our Current Allocation As Of Phase Three:

Move Your Mouse Over Charts Below For More Information

The ReadySetCrypto "Top Ten Crypto" Community Portfolio (V4)


Add your vote to the V4 Portfolio by clicking here.

Read about building Crypto Portfolio Diversity by clicking here.

What is the goal of this portfolio? 

The “Top Ten Crypto” portfolio is a democratically proportioned portfolio balanced based on votes from members of the RSC community as to what they believe are the top 10 projects by potential.
 
This portfolio should be much more useful given the ever-changing market dynamics. In short, you rank the projects you believe deserve a spot in the top 10. It should represent a portfolio and rank that you believe will stand the test of time. Once we have a good cross-section, we can study and make an assessment as to where we see value and perhaps where some diamonds in the rough opportunities exist. In a perfect world, we will end up with a Pareto-style distribution that describes the largest value capture in the market.
 
To give an update on the position, each one listed in low to high relative risk:
 
SoV/money == BTC, DCR
Platforms == ETH, XTZ
Private Money == XMR / ZEC / ZEN
DeFi == MKR / SNX and stablecoins
 
It is the most realistic way for us to distill the entirety of what we have learned (and that includes the RSC community opinion). We have an array of articles that have gradually picked off one by one different projects, some of which end up being many thousands of words to come to this conclusion. It is not capitulation because we all remain in the market. It is simply a consolidation of quality. We seek the cream of the crop as the milk turns sour on aggregate.

Current Top 10 Rankings:


Move Your Mouse Over Charts Below For More Information

Our Discord

Join Our Crypto Trader & Investor Chatrooms by clicking here!

Please DM us with your email address if you are a full OMNIA member and want to be given full Discord privileges.