


Doc's Daily Commentary

Mind Of Mav
Modern Debt Examined Part 2
So, What Exactly are the Consequences of Debt?
As we left off yesterday, debt has two potential consequences which we must pay attention to:
It can leave a rising fiscal burden for future generations
It can crowd out private investment
The Debt Snowball
The first possibility is that increasing debt levels create a “debt snowball”. If the interest on the debt is growing faster than GDP, then the debt burden of a country can grow even without taking on any new debt. As the debt compounds on itself, this can present a harsh reality for the government: either implement strict fiscal planning to reduce the debt or risk the debt growing out of control (resulting in default in the most serious cases).
However, if the interest paid on that debt is growing at a slower pace than GDP, then the burden of the debt falls over time. Below, I compare the average interest cost of the debt against the average GDP growth rates; the red line represents average interest cost to the government, while the blue line represents year-over-year GDP growth (both figures are nominal, meaning not adjusted for inflation).
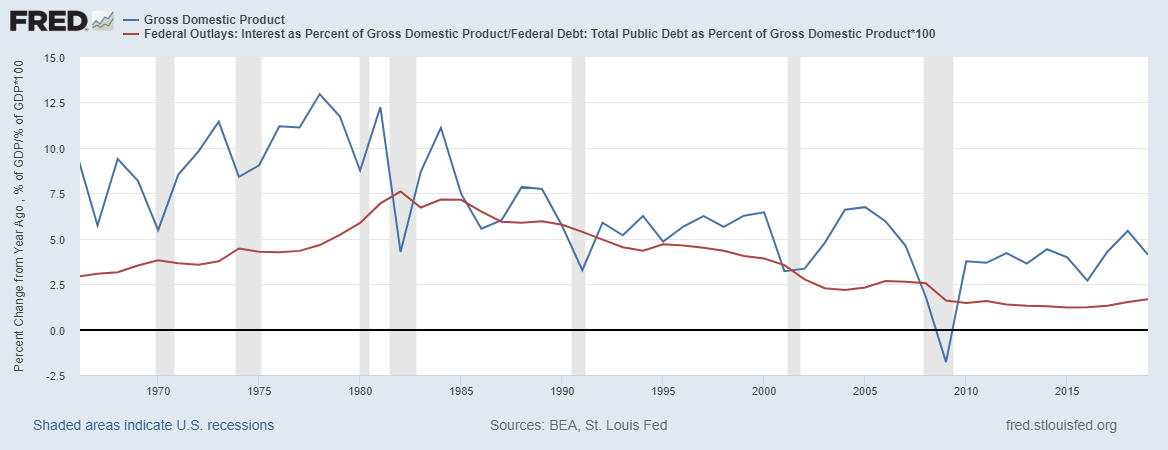
As you can see, interest generally runs below GDP growth rates — and this is especially true in the most recent decade. So long as this remains to be true in the future, the risk of a “debt snowball” remains muted.
However, there are still some reasons to be cautious. While interest costs have generally run below GDP in the past, this is not guaranteed to be the case in the future; particularly if the government acted in a way that caused lenders to lose faith in their ability to act with fiscal responsibility. At this point, lenders would demand higher risk premiums, and the government would be forced to pay higher interest rates.
Crowding Out
The second consequence is crowding out. Even if the debt carries no fiscal cost, there may still be a welfare cost to public debt. When the government increases the deficit, it increases the demand for loanable funds, pushing up interest rates and reducing private investment.
However, this is not always a relevant concern. During a recession, there is an excess of saving that the government is able to soak up. But when the economy is at full output, crowding out can become a relevant concern.
This is a more relevant concern for the US economy; in 2019, the US had just 3.7% unemployment.
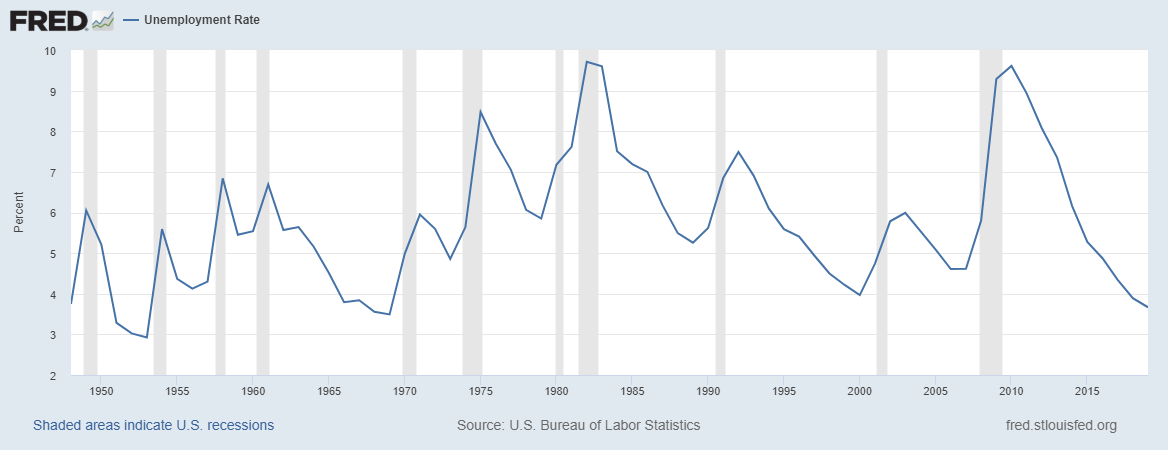
However, despite the strong economy, the government increased the deficit to 4.6% of GDP. At these levels, it is likely that it reduced private investment.
Present Times
So when the government is considering the ramifications of taking on more debt during current times, should they proceed cautiously?
The short answer is no.
The spread between economic growth rates and the interest rates the government will pay on the debt means that there is unlikely to be a fiscal cost anytime soon. Additionally, the Federal Reserve has encouraged the government to increase fiscal stimulus; and will no doubt buy up much of the debt the government issues (in which case, the debt is essentially interest-free, at least for the near future).
Secondly, crowding out is not a relevant concern at this time. Interest rates are at zero, and will almost certainly be there for the foreseeable future.
Harvard macro-economist Greg Mankiw may have worded it more succinctly than I could:
There are times to worry about growing government debt. This is not one of them.
Otherwise stated: change always occurs during a crisis, but debt remains unchanging.
The Long Term Outlook
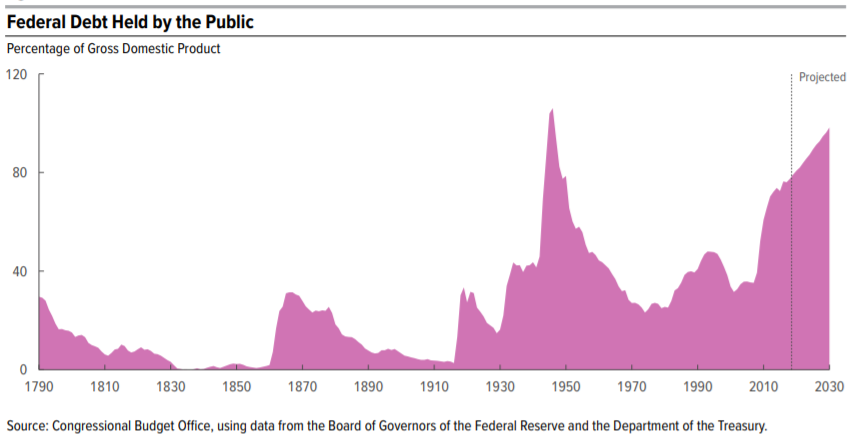
While the government doesn’t need to fret about the debt at present, that doesn’t mean they can ignore it altogether. In the long term, the US debt may very well be on an unsustainable path.
In their March 2020 update, the Congressional Budget Office projects that the federal debt held by the public by will rise from 79% to 98% of GDP in 2030 if laws remain unchanged.
Links Between Public Debt and Economic Growth
In 2010, prominent economists Carmen Reinhart and Kenneth Rogoff released an influential paper titled “Growth in a Time of Debt”. The central conclusion of the paper was a negative relationship between debt levels and economic growth when debt surpassed 60% of GDP, with the relationship becoming much stronger beyond 90% of GDP.
However, subsequent research has thrown the conclusion into doubt. First, it was discovered that the researchers have made several data errors; once corrected, the relationship was much weaker (though still present). Second, the paper did not establish a causal link between debt and economic growth, merely a correlational one. Recently, more comprehensive studies (such as Eberhardt & Presbitero’s 2013 analysis and Balazs Egert’s 2015 paper in Applied Economics) have determined that at the minimum, any “tipping point” varies across countries and there may, in fact, be no definite tipping point even within countries (rather, the relationship may simply be linear).
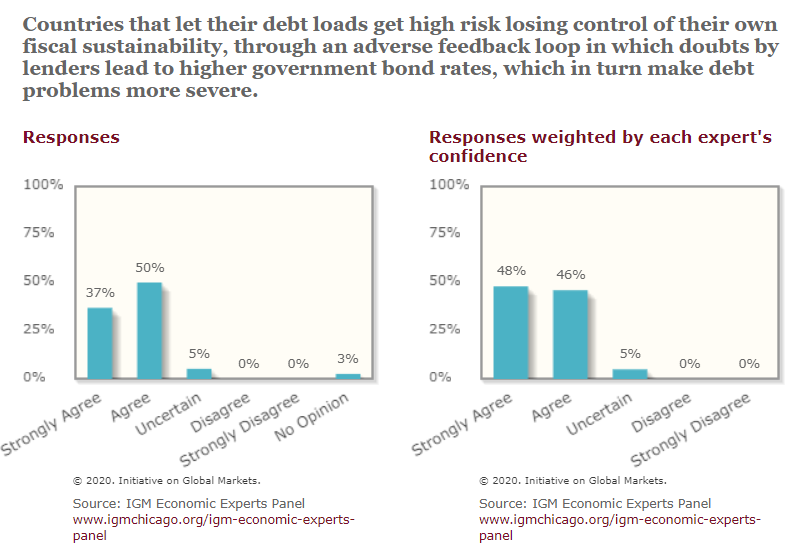
A 2013 survey of top economists confirmed that high debt levels can be problematic:
The Future Path of US Debt
With both of these facts in mind, we can see a couple of facts:
The US federal debt is increasing, and there is no evidence immediately available that it will stabilize.
Even if the specifics are up for debate, debt cannot grow indefinitely without issues.
With this in mind, it is clear that in the very long term, the US debt is on an unsustainable path. In all likelihood, the US will have a long time to correct course. However, at some point, the US will face increasing pressure to run a more sustainable fiscal path.
Conclusions
To sum it up, we can draw a few conclusions:
From both a historical and comparative standpoint, US debt is high
Large deficits, particularly when the economy is strong, can carry significant costs
From a very long term outlook, the US must rein in their spending to a more sustainable path, Modern Monetary Theory does not have any track record to convince me it will function into the future.
However, these concerns are not immediate in the face of economic catastrophe should more and more businesses go under and more people find themselves unemployed. In response, the US will continue to borrow liberally to boost the economic recovery

The ReadySetCrypto "Three Token Pillars" Community Portfolio (V3)
Add your vote to the V3 Portfolio (Phase 3) by clicking here.
View V3 Portfolio (Phase 2) by clicking here.
View V3 Portfolio (Phase 1) by clicking here.
Read the V3 Portfolio guide by clicking here.
What is the goal of this portfolio?
The “Three Token Pillars” portfolio is democratically proportioned between the Three Pillars of the Token Economy & Interchain:
CryptoCurreny – Security Tokens (STO) – Decentralized Finance (DeFi)
With this portfolio, we will identify and take advantage of the opportunities within the Three
Pillars of ReadySetCrypto. We aim to Capitalise on the collective knowledge and experience of the RSC
community & build model portfolios containing the premier companies and projects
in the industry and manage risk allocation suitable for as many people as
possible.
The Second Phase of the RSC Community Portfolio V3 was to give us a general idea of the weightings people desire in each of the three pillars and also member’s risk tolerance. The Third Phase of the RSC Community Portfolio V3 has us closing in on a finalized portfolio allocation before we consolidated onto the highest quality projects.
Our Current Allocation As Of Phase Three:

Move Your Mouse Over Charts Below For More Information

The ReadySetCrypto "Top Ten Crypto" Community Portfolio (V4)
Add your vote to the V4 Portfolio by clicking here.
Read about building Crypto Portfolio Diversity by clicking here.
What is the goal of this portfolio?
Current Top 10 Rankings:

Move Your Mouse Over Charts Below For More Information

Our Discord
Join Our Crypto Trader & Investor Chatrooms by clicking here!
Please DM us with your email address if you are a full OMNIA member and want to be given full Discord privileges.