


Doc's Daily Commentary

Mind Of Mav
Predicting The Future With Math
Looking ahead is a tricky thing.
Thankfully, when it comes to future economic conditions, we can take some shortcuts to make very educated guesses as to what will happen.
The idea that predicting future economic conditions might fly in the face of your expectations (especially this year), but there are two things that make me confident in that assertion: one, economies are very slow creatures so extrapolating out their position a year from now with broad brush strokes is nearly a guaranteed proposition, and two, humans are creatures of habit and follow patterns at both macro and micro scales that are at times hilarious, and at other times sobering in their reminder that emotions get the best of us.
So, while no one can predict the exact future, it’s certainly possible to calculate the most probable outcome — especially when it comes to global economic growth.
To make this calculation, we can start by looking at an economy as simply a collection of two things: businesses and consumers. Ask yourself: without looking at any data, what do those two groups have in common?
Well, they’re both made up of humans (at least until DAOs take over), and because they’re human-driven, they both suffer from the human condition and those emotions I was just talking about.
So, without digging into a bunch of complex mathematics and economic theory, we can instead make very accurate economic predictions by narrowing down the massive amount of data and heuristics and minutiae and instead focus on a single unifying factor between businesses and consumers: sentiment.
Let’s start with consumers.
Consumer Confidence Index
First, a couple of pointers about looking at consumer sentiment.
For decades now, what’s been absolutely true is that the U.S consumer has determined the world’s economic health. When Americans stop spending, the global economy goes into recession, and when they start spending again, economic activity recovers. That’s how simple — and fragile — the global economy has become. We talked yesterday about the cold war between the US and China, and right at the center of that war is the U.S. Dollar.
Behind the U.S. Dollar is the U.S. consumer (hello!), so we’d do well to understand them.
The best way to measure U.S consumer sentiment is to analyze the University of Michigan’s Survey of Consumers Index. It shows “how Americans view prospects for their own financial situation, how they view prospects for the general economy over the near term and their view of prospects for the economy over the long term.”
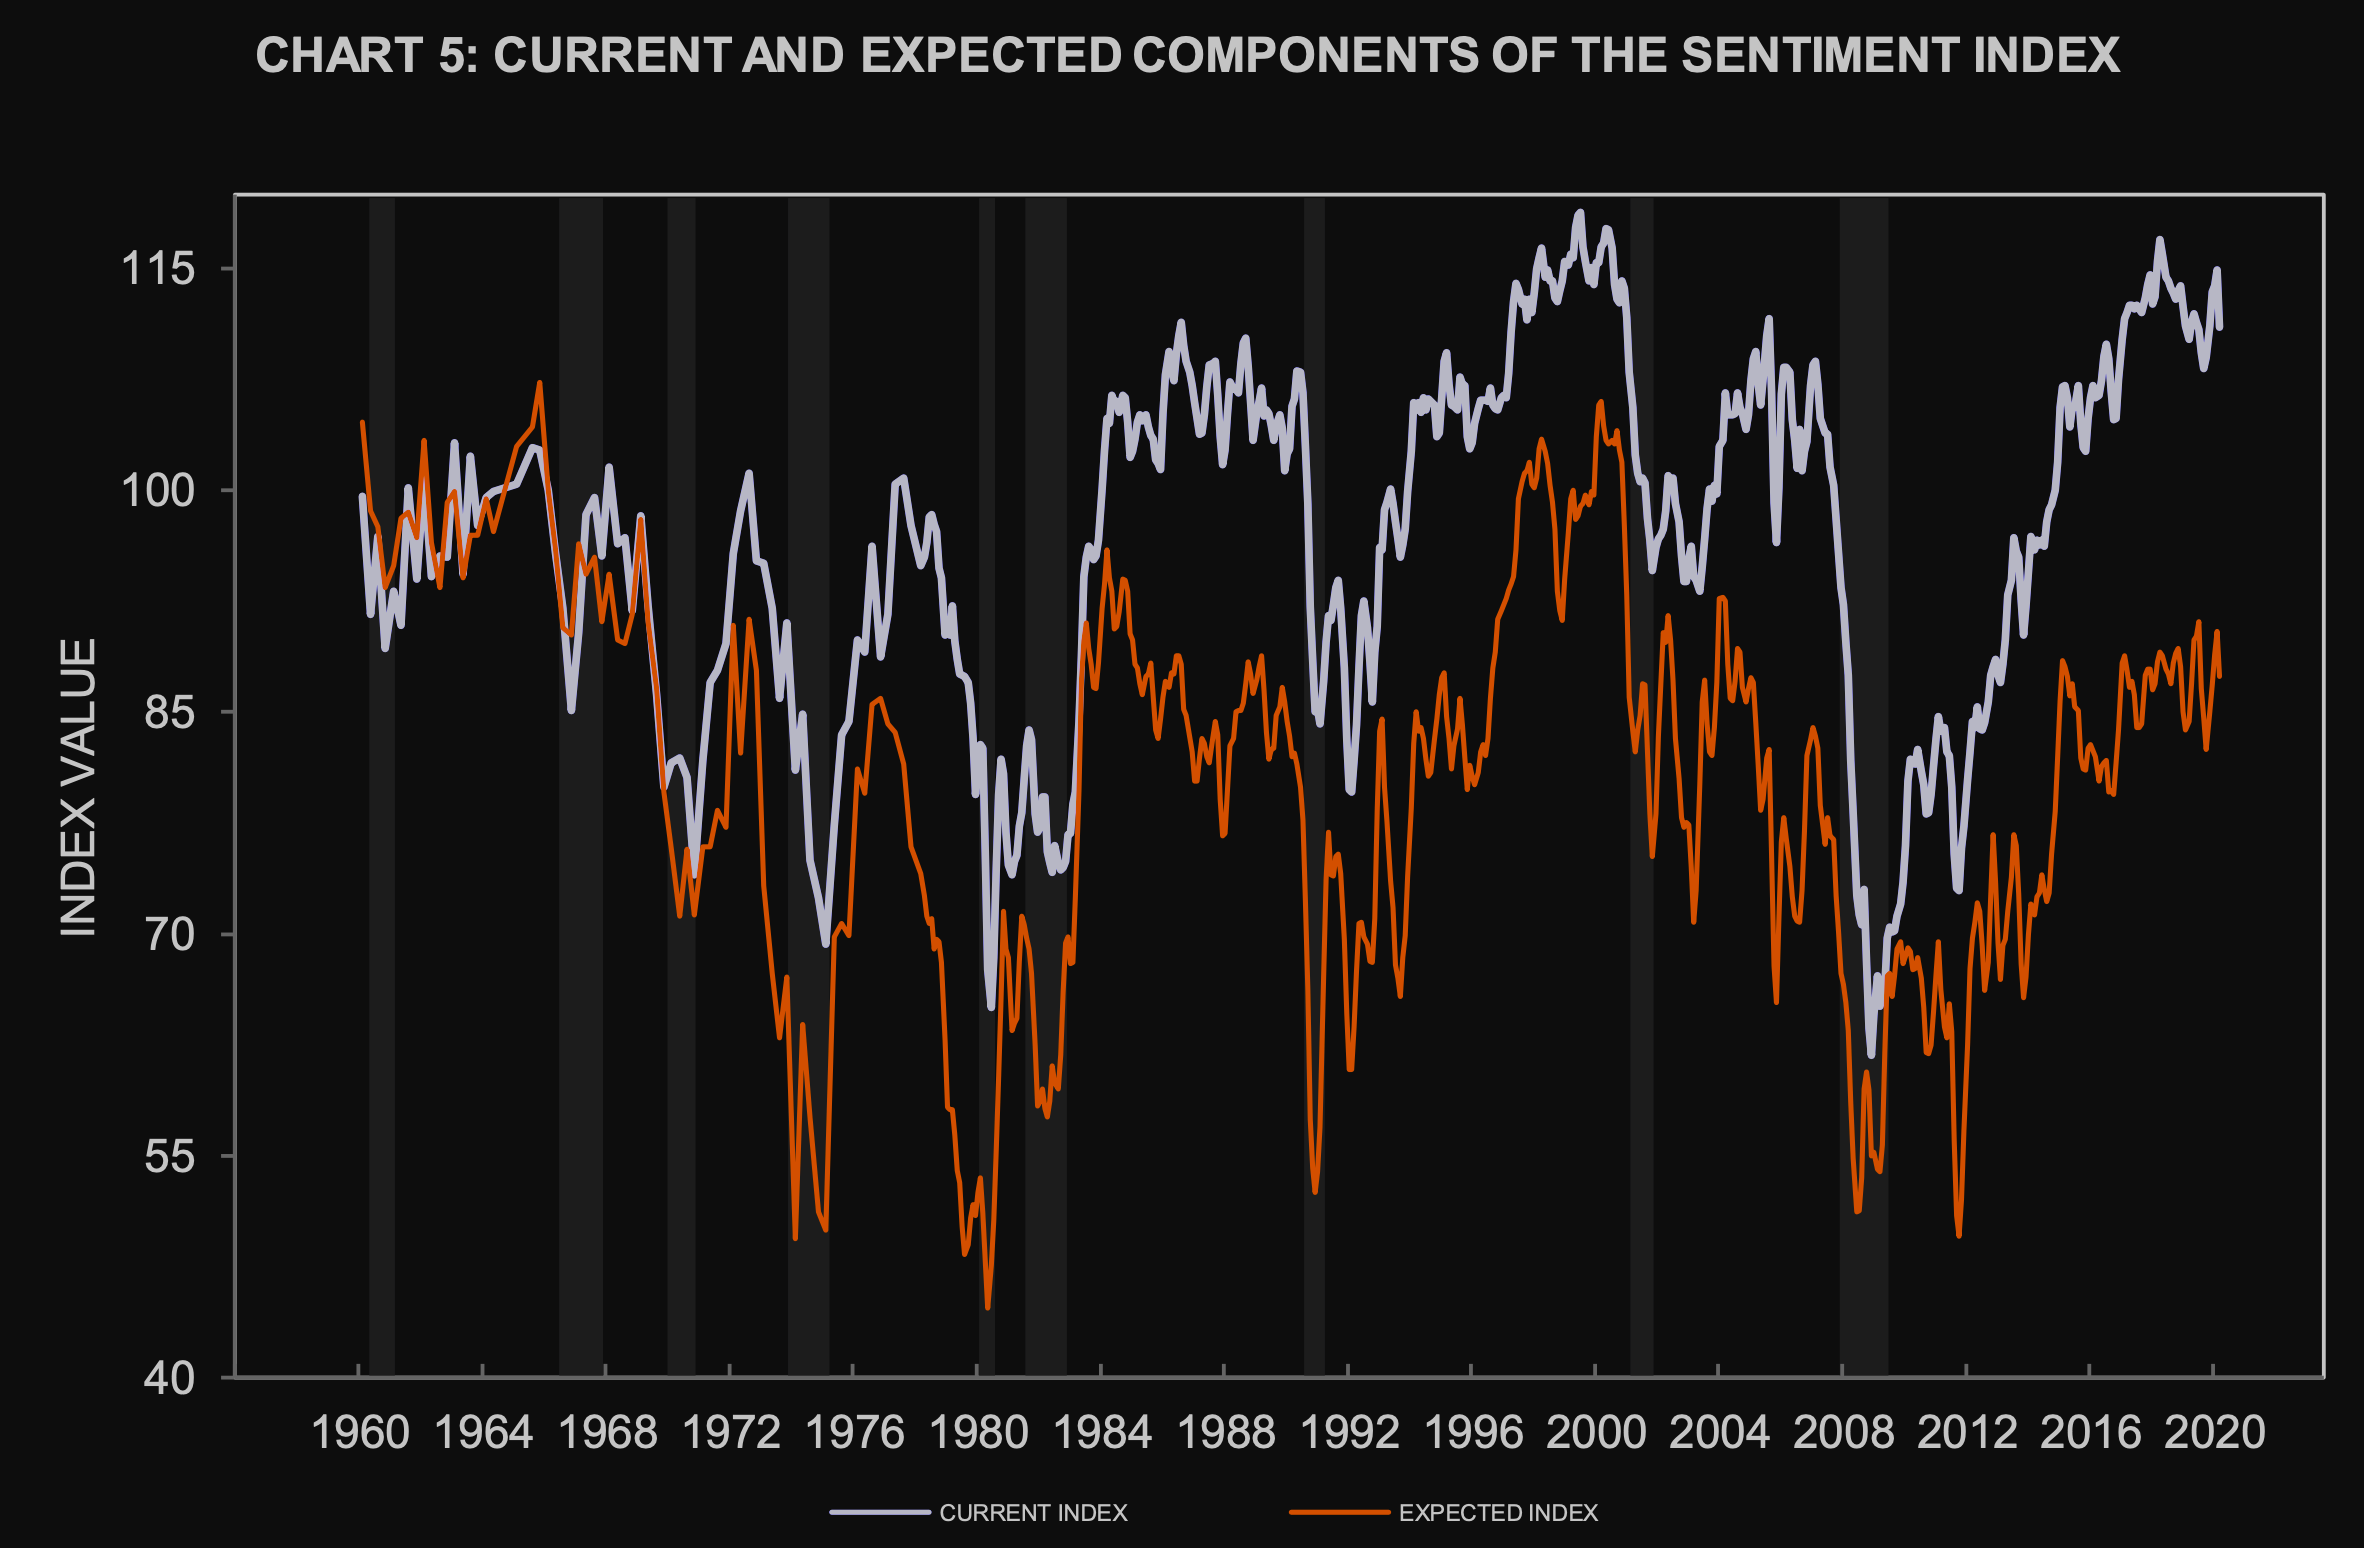
Because we’re wizards trying to predict the future, all we care about is the relation between that sentiment index and the big G — gross domestic product, or GDP.
GDP is one of the most central metrics of modern economics because it (arguably poorly) represents the aggregate measure of production from a country. Aiming for 2% GDP growth year-over-year is essentially one of the Ten Commandments of capitalist societies today; anything less is heresy.
So, here’s the magic.
To predict the future growth rate, we create a simple line chart with GDP growth on the primary axis and sentiment levels on the secondary axis, then compare similar data points.
. . . and that’s it!
Simple, right?
But very powerful, too. Sentiment and production are yin and yang. They support each other, and without a balance between them, everything else goes off the rails.
Using this method, if we map the U.S consumer’s expectations onto GDP growth, the latest reading of 71.8 predicts negative GDP growth. Obvious in today’s tumultuous environment, yes, but what’s likely is that 2020 will be like 2008: memorialized for how tremendously terrible it was, but also a motivational reminder to the average consumer to put it in the rear-view mirror and focus on picking up the pieces.

That ebb and flow is what we really care about here — it is as inevitable as human nature itself.
Yes, GDP will fall in the year ahead based on our model, but what will come after? Thinking like that helps you stay above the noise of today.
Business Confidence Index
Let’s switch gears and talk about business sentiment.
When it comes to economic data, it’s a myth that Wall Street has an edge over retail investors. There’s no delay between the “smart money” and the “dumb money” receiving important market information as data companies embargo their information before publishing. For example, today, ZEW will release Germany’s economic sentiment at 10 am, and this Friday, Japan’s Ministry of Internal Affair will release Japan’s latest inflation rate.
And it’s no different with business sentiment.
PMIs (purchasing manager’s indices) are leading indicators, released monthly, that measure business confidence in a country or region. A reading of 50 signifies zero growth, above 50 signifies positive growth, and below 50 signifies negative growth. For example, if a PMI comes in at above 50, purchasing managers expect the economy to grow, and vice versa.

The world favors a particular PMI for each major economy.
In the U.S, it’s the ISM’s Report On Business. According to ISM’s website, “The ISM Report On Business, Manufacturing, and Non-Manufacturing are two of the most reliable economic indicators available, providing guidance to supply management professionals, economists, analysts, and government and business leaders.” The report surveys over 800 business managers within the biggest U.S companies to measure future economic expectations.

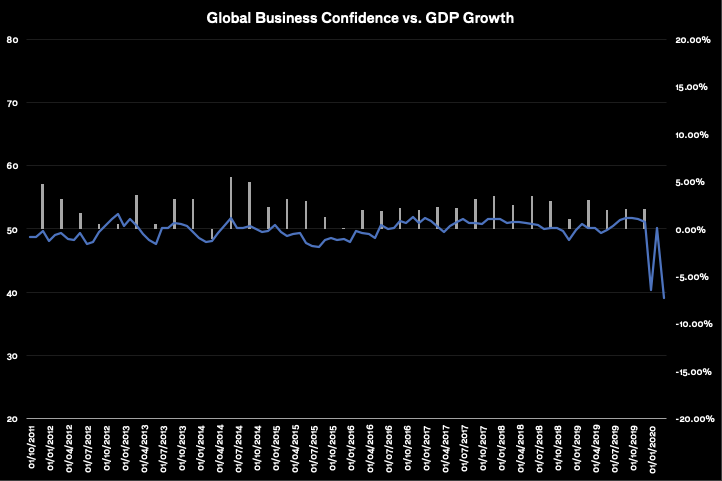
In Europe, the E.U combines all of its member countries’ data into one index: their official business confidence indicator, ESI (European Sentiment Indicator). According to the European Commission’s website, the index is a result of “regular harmonized surveys conducted by the Directorate-General for Economic and Financial Affairs for different sectors of the economies in the European Union (EU) and in the applicant countries.”

In China, the situation’s a little different: the CCP is known to manipulate the official China PMI (big shocker there) so it’s better to use Caixin’s China PMI. According to Caixin, “the Caixin Manufacturing PMI Purchasing Managers’ Index measures the performance of the manufacturing sector and is derived from a survey of private 430 industrial companies [in China].”

With these data sets, we repeat the steps we performed on the consumer sentiment data: weigh GDP on the primary axis with PMI levels on the secondary axis to get an accurate indication of future economic growth (or regress).
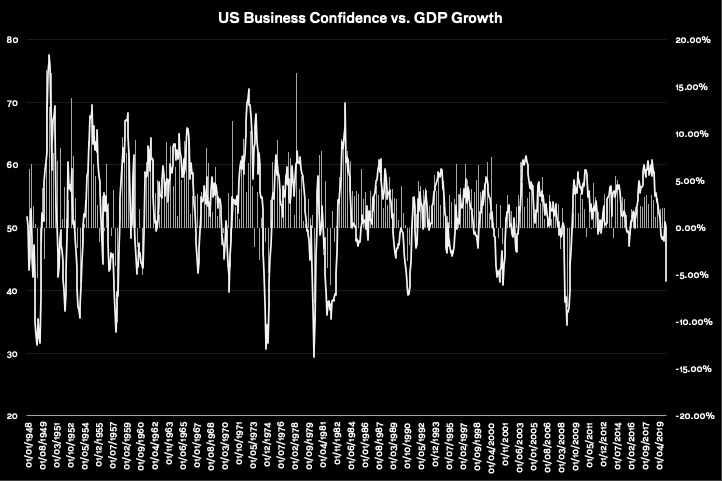


As you can imagine, due to COVID-19, the latest data shows we’re about to see double-digit declines in GDP.
However, we’re not done.
We’ve been able to predict that GDP will slow, but we haven’t yet calculated the rate of change.
This is important to know because if we only focus on the absolute GDP number, we have no idea how economic activity has shifted over time, especially in the past month or in the past year.

EU PMI 1 Year History
Going back to my point about looking beyond what the data is telling you, we have to look at this data as a present point on a graph that has a past as much as a future.

US PMI Forecast

EU PMI Forecast

China PMI Forecast
For example, let’s say we determine that GDP will rise 2%. That’s the magic percentage growth number I mentioned earlier, so it’s all peaches and cream, right? Well, maybe if you’re looking at that single data point, but that doesn’t take into account last quarter when GDP grew by twice that amount.
Always remember that humans feel loss more deeply than gain (we’re a miserable bunch). So, in this example, the global economy wouldn’t see 2% growth — they’d see a 50% reduction in production and that’s catastrophic, even with GDP still growing!
In a sense, just like consumer feel loss more than gain, businesses and economies are much more sensitive to slowing versus growing.

US vs EU PMI
December 2018 was a great example of why this is so important to pay attention to: PMIs and consumer confidence indices showed a growing global economy. Everything seemed great — but the month-over-month and year-over-year numbers revealed a huge decrease in the rate of growth.

US vs CHINA PMI
If you ignored the rate of change as it moved from faster to slower growth you’d have been oblivious to the impending sell-off in risk assets. By Christmas Eve, the S&P500 had fallen 12%, oil had plunged 11%, and copper had dipped 9%.
So, tomorrow let’s take notice, and get our hands dirty with some data. I promise it won’t be painful.

The ReadySetCrypto "Three Token Pillars" Community Portfolio (V3)
Add your vote to the V3 Portfolio (Phase 3) by clicking here.
View V3 Portfolio (Phase 2) by clicking here.
View V3 Portfolio (Phase 1) by clicking here.
Read the V3 Portfolio guide by clicking here.
What is the goal of this portfolio?
The “Three Token Pillars” portfolio is democratically proportioned between the Three Pillars of the Token Economy & Interchain:
CryptoCurreny – Security Tokens (STO) – Decentralized Finance (DeFi)
With this portfolio, we will identify and take advantage of the opportunities within the Three
Pillars of ReadySetCrypto. We aim to Capitalise on the collective knowledge and experience of the RSC
community & build model portfolios containing the premier companies and projects
in the industry and manage risk allocation suitable for as many people as
possible.
The Second Phase of the RSC Community Portfolio V3 was to give us a general idea of the weightings people desire in each of the three pillars and also member’s risk tolerance. The Third Phase of the RSC Community Portfolio V3 has us closing in on a finalized portfolio allocation before we consolidated onto the highest quality projects.
Our Current Allocation As Of Phase Three:

Move Your Mouse Over Charts Below For More Information

The ReadySetCrypto "Top Ten Crypto" Community Portfolio (V4)
Add your vote to the V4 Portfolio by clicking here.
Read about building Crypto Portfolio Diversity by clicking here.
What is the goal of this portfolio?
Current Top 10 Rankings:

Move Your Mouse Over Charts Below For More Information

Our Discord
Join Our Crypto Trader & Investor Chatrooms by clicking here!
Please DM us with your email address if you are a full OMNIA member and want to be given full Discord privileges.