

Doc's Daily Commentary

Mind Of Mav
The Data Behind The NFT Craze
Crypto decentralized applications create a new paradigm of data transparency that did not exist in the conventional web 2.0 applications. I have argued before that is a key feature that will define the next generation of consumer platforms. In this newsletter, I will attempt make this more concrete by showing you an example of this data transparency at work. In particular, we will dive deep into the data behind the meteoric rise of NFTs.
NFTs have skyrocketed into the mainstream consciousness over the past few months. From Time magazine creating TIMEPieces, to TikTok setting up a creator-led collection, to Steph Curry buying a Bored Ape, NFTs seem to be everywhere. In case you are unfamiliar, NFT stands for non-fungible token and is defined by the ERC721 and ERC1155 interface standards. In less technical terms, they are unique, hence non-fungible, scarce, digital assets on the blockchain that can be owned and transferred.
The concept of digital ownership is not new, and has been widely used in gaming contexts to allow players to customize their experiences via skins, upgrades, etc. The crypto version of digital assets and ownership is a meaningful evolution from this, because they are provably unique and not governed by a single centralized entity. The fact one owns something on the blockchain can be independently verified by anyone who can access the blockchain ecosystem— making them much more portable across applications. For example, one could imagine a world where the owner of an NFT avatar is the only one who is able to use that avatar across all their favorite social platforms. In that world, NFTs become augmentations of the digital identity, and can be extended to many more applications beyond just avatars. However, this potential is largely unfulfilled today, and many NFT collections are, quite frankly, shallow projects that try to make a quick buck.
This is why NFTs are such a polarizing topic — some believe that they pave the way for the metaverse and other believe they are nothing more extremely over-priced JPEGs. I will not try to nudge you in one direction or another, but I would like show you how crypto data can be used the understand both the macro trend and micro trends in NFTs.
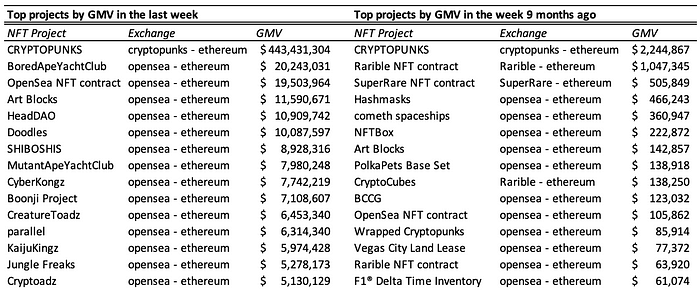
NFT marketplaces
The primary channels through which people have interacted with NFTs to date have been exchanges like Opensea, Foundation, SuperRare, Rarible, etc. Some NFT smart contracts, most notably Cryptopunks, also implement their own exchange capabilities. These exchanges are decentralized applications on the blockchain that enable users to discover, buy and sell NFTs. By decoding the transactions, traces, and logs generated by these smart contracts, using the techniques I described in this post, we can create a dataset that contains the details of every single NFT trade in the Ethereum ecosystem [1].
As an example, The relevant contracts for Opensea are the WyvernExchange contract on Ethereum, and two ZeroExFeeWrapper contracts (1 and 2) on Polygon. The specific function and event of interests are atomicMatch_ and OrdersMatched for the Ethereum contract and machOrders and Fill for the Polygon contracts. The other exchange applications implement their own flavors of these methods and events, but they generally follow a similar convention. Decoding these allows us to extract relevant details from any given NFT transaction, i.e. the buyer, seller, timestamp, NFT contract (NFTs are smart contracts too), specific NFT IDs, currency used in the transaction, and price.
Using this dataset, we can see that the gross merchandize value (GMV or sum of transaction values) of the NFT trades first inflected in Feb 2021 — growing ~20x from ~$25M in Jan 2021 to ~$450M in Feb 2021. This was driven largely by the growth of Opensea’s Ethereum exchange and Cryptopunks.
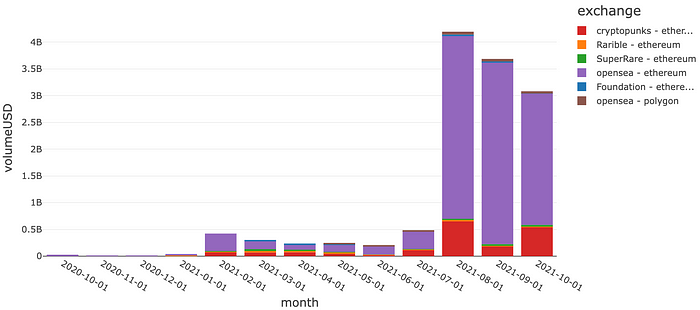
The momentum then stalled until July and Aug, when the GMV absolutely exploded to about $4.2B, again largely driven by the growth of the Opensea and Cryptopunks [2].
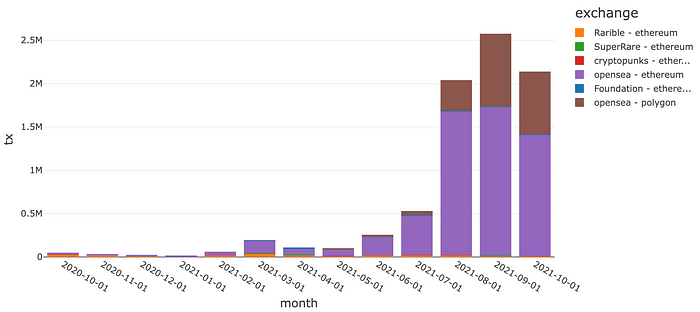
A similar trend can be observed in the number of transactions…
… and buyers
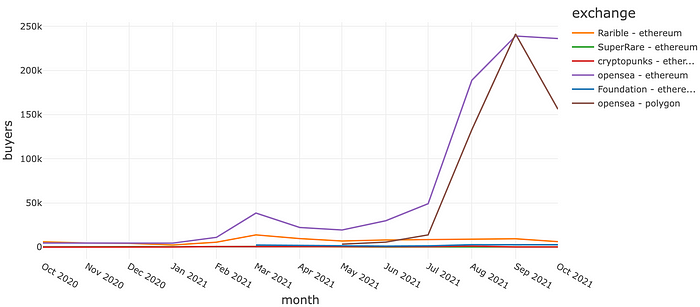
To provide a sense of scale, Ebay and Etsy did about $19.5B[3] and $3B[4] of GMV in Q3 2021, respectively. In the 3-months ending Oct 2021, the total GMV of all NFT traded is $10.9B, with ~$9.3B coming from Opensea alone. This is more than ~3x that of Etsy and about half that of Ebay. This is truly impressive scale, especially for a marketplace that basically did not exist a year ago.
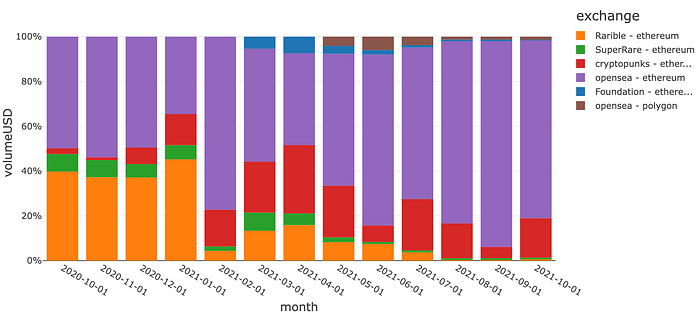
Another notable trend is the growing share of Opensea in the NFT market. In Jan 2021, Opensea had about 35% of the GMV, about 10 pts behind the then leader in Rarible. Since then, Opensea has managed to capture ~85% of the GMV market share, with Cryptopunk being the only other exchange with any meaningful volume. The lead is even larger if we compare share by transactions or buyers.
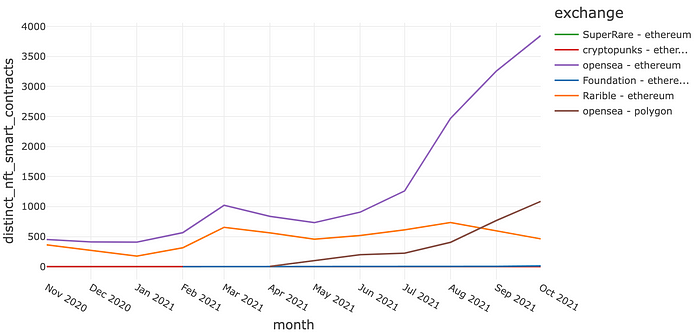
This begs the question of “how was Opensea able to capture the NFT lightning in a bottle”. While we will not be able to answer this question definitely without knowing the product roadmap and delivery for each of the exchanges throughout 2021, we can look for clues in the smart contract data. In particular, if we examine the number of different NFT collections [5] that were traded on the different exchanges, we see that Opensea and Rarible were neck-to-neck at the end of 2020. However, Opensea was able to significantly increase the number of NFT collections traded in 2021, and opened up a nearly 7x lead against Rarible, who stayed relatively flat, by the end of Oct.
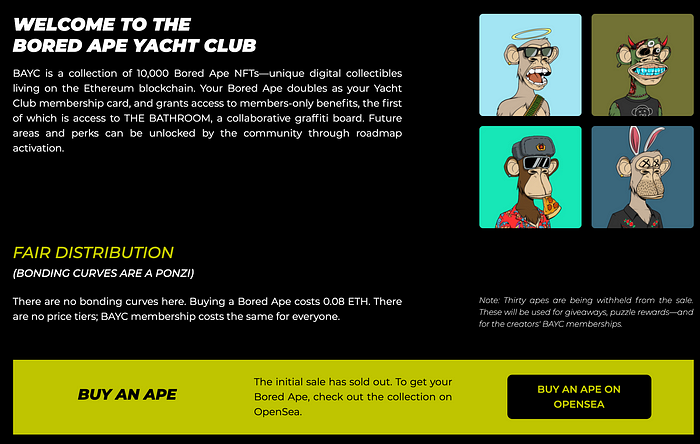
I believe this is the driving force behind Opensea’s growing market share. By leveraging the data transparency of the Ethereum blockchain, Opensea focused on quickly identifying new new NFT projects and making them available for discovery and sale on its platform [6]. This deliberate strategy made it the go to place to discover and buy the new hot projects. Coupled with the high level of excitement and FOMO from the crypto community, this advantage quickly compounded into a dominant mindshare with would-be buyers and the network effect of every new NFT project making Opensea their default secondary market. See, for example, the “buy” link on Bored Ape Yacht Club’s website.
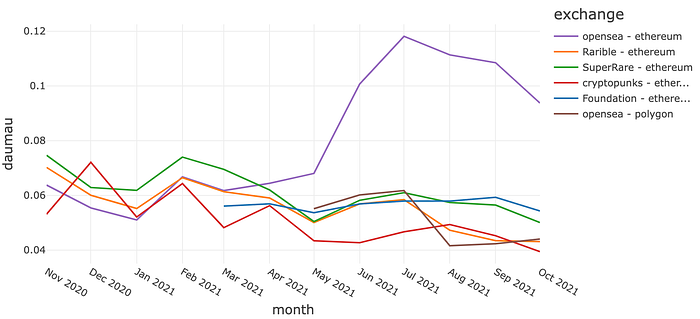
We can also observe concurrent shifts in consumer behavior that seem to corroborate this hypothesis. Specifically, we can see that Opensea’s buyer engagement, as defined by DAU/MAU or number of daily unique buyer divided by number of monthly unique buyers, started to increase in March 2021, right around the time the number of collections started increasing, and reached as high as 12% in July 2021. This is nearly double that of the competitor exchanges, who all stayed relatively flat at less than 5%.
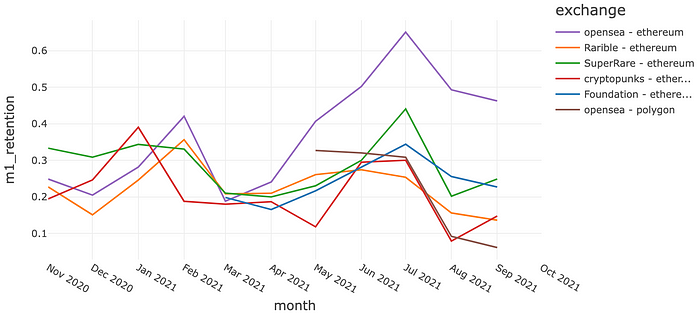
A similar trend is seen in Opensea’s buyer retention, as defined by the portion of buyers that purchase again within one month of their prior purchase. This retention metric also also started increasing around March, and reached as high as 65% in July. This, again, is nearly twice as high as that of the competitor exchanges.
Of course, these data points alone do NOT prove the causal relationship I posited in my hypothesis. They are simply correlations that are consistent with the theory. To prove the hypothesis, we would likely need to supplement the transaction data with data from product roadmap to understand features and implementation timeline at each of the exchanges, and qualitative interviews with NFT buyers and creators to understand why they chose Opensea over other exchanges. We will not pursue that in this newsletter, but hopefully we have shown an example of how crypto data can be a powerful lens for analyzing the growth and evolution of decentralized consumer applications.
Closing thoughts
NFTs have been on a wild ride and it is still achieving staggering levels of GMV despite signs of slowing down from the peak. One can certainly make a credible argument that this is a bubble that will eventually burst, but people who said this about the initial inflection in Feb 2021 were certainly proven wrong, at least for now. There is a ton of creative energy in this space, and new projects are emerging all the time. With the exception of a few projects like CryptoPunks, the top NFT projects by GMV have completely changed relatively to 9 months ago.
It is hard to predict if any one project will succeed, and it is even harder to divine what the broader NFT ecosystem will become, but with the data transparency we get with crypto smart contracts, we can have a front row seat to the show as it unfold.
[1] There are quite a few other NFT ecosystems starting to emerge outside of Ethereum. Most notably the Solana NFT ecosystem and centralized exchanges like Coinbase and FTX. I may augment the analysis to include these in a future analysis
[2] Cryptopunks is a single collection of 10k NFT avatar images. It is highly valued and sought after within the NFT community because it is one of the first Ethereum NFTs ever created. It is also widely thought to have helped defined the ERC721 standard which is the backbone of many NFTs project today.
[3] Ebay 10Q https://d18rn0p25nwr6d.cloudfront.net/CIK-0001065088/6a4215c2-5a07-4f46-88c1-6fbdf496b6a0.pdf
[4] Etsy 10Q https://d18rn0p25nwr6d.cloudfront.net/CIK-0001370637/673e5ce5-839c-48a3-911a-a9e68e855677.pdf
[5] A collection is a group of NFTs from the same project. CryptoPunks is one such collection, which trades on its own exchange.
[6] This is a hypothesis and an anecdotal observation from me as a participant in the ecosystem

The ReadySetCrypto "Three Token Pillars" Community Portfolio (V3)
Add your vote to the V3 Portfolio (Phase 3) by clicking here.
View V3 Portfolio (Phase 2) by clicking here.
View V3 Portfolio (Phase 1) by clicking here.
Read the V3 Portfolio guide by clicking here.
What is the goal of this portfolio?
The “Three Token Pillars” portfolio is democratically proportioned between the Three Pillars of the Token Economy & Interchain:
CryptoCurreny – Security Tokens (STO) – Decentralized Finance (DeFi)
With this portfolio, we will identify and take advantage of the opportunities within the Three
Pillars of ReadySetCrypto. We aim to Capitalise on the collective knowledge and experience of the RSC
community & build model portfolios containing the premier companies and projects
in the industry and manage risk allocation suitable for as many people as
possible.
The Second Phase of the RSC Community Portfolio V3 was to give us a general idea of the weightings people desire in each of the three pillars and also member’s risk tolerance. The Third Phase of the RSC Community Portfolio V3 has us closing in on a finalized portfolio allocation before we consolidated onto the highest quality projects.
Our Current Allocation As Of Phase Three:

Move Your Mouse Over Charts Below For More Information

The ReadySetCrypto "Top Ten Crypto" Community Portfolio (V4)
Add your vote to the V4 Portfolio by clicking here.
Read about building Crypto Portfolio Diversity by clicking here.
What is the goal of this portfolio?
Current Top 10 Rankings:

Move Your Mouse Over Charts Below For More Information

Our Discord
Join Our Crypto Trader & Investor Chatrooms by clicking here!
Please DM us with your email address if you are a full OMNIA member and want to be given full Discord privileges.